07 noviembre 2018

desorden de los mercados

Son estos días que tan pronto suben como bajan, sin ton ni son…, al calor de decisiones de los tribunales, de lo que diga Bruselas, de lo que hagan las FANG…, de lo que sea.

¿Se pueden leer el orden y el caos en los mercados?

En estos días, como viene siendo habitual, todo el mundo está diciendo que el mercado se cae, que si la guerra comercial, que si la guerra de divisas, que si Trump por aquí, que si los presupuestos de Italia por allí…
La cuestión es que los mercados bursátiles mundiales, a falta de que cierre mañana el mes, se han pegado una torta del 10% desde máximos (MSCI World); un 8,5% el S&P500, un 7,5% el Eurostoxx600 desde máximos de octubre, con caída de hasta el 9% durante el mes, un 12,5% el Nikkei y casi un 11% el Hang Seng chino.
Los primeros párrafos, casi anecdóticos, vienen por el hecho de que se trata de “cómo tratamos la información”. Es un tema que me gusta mucho, porque es el nexo entre la psicología individual y colectiva y los mercados con sus resultados finalistas. En medio y en todo está “cómo manejamos la información” y sobre todo “cómo la interpretamos”.

# 2015: el punto de inflexión

En agosto de 2015 se produjo una caída muy grande en los mercados, como he relatado en otras entradas, hubo un día en el que los mercados literalmente se secaron. Aquello parecía el Armagedón.
En enero de 2016 pasó casi lo mismo.
Si analizabas los mercados (bolsas) desde un punto de vista técnico aquello tenía todas las señales en grande y negrita de que se caía al averno.
Y sin embargo no lo hizo.
2016 fue un año raro, difícil para la gestión financiera, pero el último trimestre despegó como un cohete y se pegó casi año y media subiendo como un diablo.
Se estaba dando una paradoja.
Una paradoja se produce cuando nuestro conocimiento ha llegado al límite. No puede explicar lo que está ocurriendo en la realidad, y la realidad es la que manda así que hay que hacerse nuevas preguntas y generar ideas para resolverlas.
Yo había llegado a ese límite. Me di cuenta de que con las herramientas analíticas que manejaba estaba muy lejos de leer lo que estaba ocurriendo “en el momento” o en un nivel previo. Leer a toro pasado, todos lo sabemos hacer.
Algunas realidades confirmadas:
1) La información macroeconómica no sirve para leer y/o anticipar los movimientos de mercado (con precisión). Está cocinada y va con retardo.
2) Los indicadores técnicos se desarrollan sobre el precio, son muy limitados y reactivos. No nos pueden dar una lectura de contexto.
3) Los únicos movimientos que nos deberían interesar leer son los grandes, el resto es aleatorio y nos deberían dar igual porque a largo plazo la renta variable sube.
4) Hay una cosa que se llama orden y otra que se llama caos y quería entenderlas. Cuando pasamos del largo plazo al corto plazo se invierten (esto lo descubriría después).
5) Cada cierto tiempo se da una crisis, una caída prolongada de mercado. Pero cada crisis es producida y se materializa de manera distinta. Se repite con cierta frecuencia (y estacionalidad) las crisis y caídas bursátiles, pero no se repite nunca la forma en que se producen, qué las origina y cómo se materializan. Existen analogías (deducidas después) pero nunca son iguales.

# Cómo hacer frente a la paradoja

A partir de ese momento comencé a trabajar sobre información de diversa naturaleza, que tuviera un nexo y que en conjunto nos ofreciera otro tipo de información (conocimiento) clara, precisa y se adelantara a cada movimiento grande de mercado.
Lo que tenía claro es que, más allá de resultados matemáticos, porcentajes y ratios, necesitaba información visual. En otras palabras, necesitaba una experiencia directa desde arriba, no una pseudoconlusión mental desde abajo; un vistazo y una información concentrada valiosa en un contexto más amplio.
Unas veces venía porque tenía una idea y la trabajaba, otras veces por puro azar leyendo algo surgía una idea hecha que daba lugar a otra.
No era fácil, había semanas completas en las que estaba trabajando sobre una idea, con series temporales, y al finalizar la semana, tenía que tirar a la basura todo el trabajo hecho.
Si el indicador sobre el que estaba trabajando no era contundente, claro, sin lugar a dudas, entonces no valía.
Así que poco a poco comencé a trabajar sobre diferentes aspectos de la economía y los mercados financieros, que tuvieran sentido, se adelantaran a los grandes movimientos de mercado y además ofrecieran buenos resultados. Y sin darme cuenta estaba constituyendo un panel de indicadores propios y algunos ya existentes.
Como también estaba investigando sobre la complejidad, el azar y el orden, quería comprender cómo llevarlo a la práctica en el largo plazo y de manera relativamente sencilla.
Esto ya era una tarea de un nivel superior, que superaba a este blog, así que todo este conocimiento lo fui trasladando al que es ahora nuestro gran proyecto participativo: Uncommon Finance.
No es de extrañar por lo tanto que el primer punto de los “Uncommon Beliefs” que es el código “filosófico” que guía al hub, sea:
No evitamos la paradoja, salimos a buscarla.
Así que conseguimos poco a poco relacionar los siguientes aspectos, con resultados contra mercado (realidad) buenos y bastante precisos:
– Precios de renta variable a nivel global y por regiones
– Precios de renta fija a nivel global y por regiones
– Precios de materias primas a nivel global y por regiones
– Tipos de interés de largo y corto plazo
– Diferenciales de tipos de interés entre economías
– Incertidumbre de mercado
– Decisiones sobre incertidumbre de operadores profesionales
– Nivel de empleo de economías desarrolladas
– Precios inmobiliarios
– Nivel de apalancamiento para invertir
– Operativa de los grandes institucionales fuera de las bolsas
– Movimientos de fondo de los mercados
– Evolución de precios (inflación) de la economía
– Ciclo económico
Todo esto intercorrelacionado y con timing. La lectura y la experiencia directa son otra cosa.

# Enero y octubre de 2018

Para leer el momento en el que estamos, bajo un contexto mayor, básicamente solo miro esta información. Diez minutos al mes. Como los indicadores de manecillas en los puestos de los aviadores, o lo supervisores visuales de los modelos de predicción meteorológica. Lo que va sucediendo y sale a través de las noticias son consecuencias de problemas que llevan tiempo cocinándose en la economía, no al revés.
Por resta razón dejar de seguir las noticias es un buen ejercicio, porque cuando vuelves a leerlas un día te das cuenta cómo funciona el orden que se está formando de fondo y las aristas que van saliendo, calcificando. Ya nunca verás igual. Queremos ver ese orden de fondo que está formando una complejidad mayor y que se va a manifestar en movimientos violentos.
Y tampoco queremos empezar a hacer cábalas; si algo sobra aquí es retórica.
Experiencia si, intelectualización no. Ahora sí, ayer no.
Volviendo a los indicadores de momento, nos avisaron de que algo podía suceder con mes y medio de antelación. Llevaban dormidos desde verano de 2015.
La cosa está así:
Hay 6 indicadores estructurales (de largo plazo) y 3 de momento (corto plazo). Adicionalmente miro otro de apoyo.
La lectura de lo que está ocurriendo y puede ocurrir, en un nivel contextual, se puede hacer de muchas formas y desde muchos enfoques.
Todos pueden ser correctos.
Pero cada persona somos diferentes y enfocamos e interpretamos la realidad de una manera diferente, porque tenemos una estructura psicológica y una experiencia vital distintas.
Estoy seguro de que Ray Dalio tiene una visión mucho más precisa y acertada con información macroeconómica de la que tendré yo, probablemente, en mi vida. Como las otras grandes luminarias desde su particular punto de vista.
Pero yo no soy Ray Dalio. Soy Jorge Segura. Como tú en tu vida no vas a ser Warren Buffet, George Soros ni John Bogle. Eres “tu nombre  + apellido paterno + apellido materno”.
En mi caso el enfoque es el siguiente: complejidad/orden desde el punto de vista “ecosistema”. Luego ya entraré a valorar la empresa-negocio-activo que sea desde abajo, pero el framework es ese.
En el largo plazo las cosas van con cierto orden, pero la complejidad se va alimentando en el fondo, hasta que en cierto punto se invierte, la complejidad emerge e impone un nuevo orden. En este nuevo orden las reglas ordinarias no valen, hay que hacer otra lectura.
No me voy a extender con esto. Da para un libro.
Lo que nos estaban diciendo los indicadores de momento el 1 de septiembre es que había una muy alta probabilidad de que los mercados cayeran de manera significativa a corto plazo (caídas superiores al 8%), sin que ello implicara una crisis bursátil ni económica.
La idea de fondo es la siguiente:
En “normalidad”:
– A largo plazo existe un orden, una dinámica que funciona dentro de la “normalidad”, donde las herramientas analíticas convencionales funcionan. Esto es durante el 90% del tiempo.
– A corto plazo nos movemos en aleatoriedad y azar. Hay caos y desorden.
Cuando el caos se despliega:
– En el largo plazo se va generando otro nivel de orden, el caos, que es no lineal y no aparente. En determinado momento el caos se despliega. En estos momentos aparece el desorden y el caos. El largo plazo se convierte en caos y los mercados se vuelven “indomables”.
– El corto plazo pasa del “desorden y caos” al orden, es el que manda, pero las herramientas de análisis dejan de funcionar. Toda la teoría financiera convencional sobre gestión de carteras (Teoría de carteras eficientes de Markowitz, modelo de valoración CAPM y modelo de valoración Scholes-Merton) dejan de funcionar.
Debemos utilizar herramientas no lineales, porque las escalas han cambiado.
O utilizar herramientas lineales desde otro enfoque, desde fuera, desde la “no explicación”.
Bueno, el cuadro de indicadores de Uncommon Finance trata de leer esta complejidad, y de leerlo con tiempo y adelantarse. Todo esto va aumentando la incertidumbre.
Esta es el enfoque de los indicadores de lectura; el caos y orden en el largo y corto plazo desde una visión ecosistema.
A nivel estructural (o de orden de fondo) por ahora no nos confirma un movimiento mayor, producido por un orden más profundo (la señal de recesión/pánico bursátil), pero estaremos atentos porque no andan lejos y van en una dirección.
Nosotros seguiremos estudiando e investigando para tener una mejor comprensión de toda esta realidad cambiante. Los procesos automatizados y la economía digital han reducido la complejidad de ciertos procesos… pero llevan aparejada nueva complejidad, a la que hay que dar respuesta. Y esta es nueva.
Abrazos,
PD1: ''Si juzgas a la gente, no tienes tiempo para amarla'', Santa Teresa de Calcuta.

06 noviembre 2018

el dólar se tiene que depreciar...

A pesar de la FED, el dólar tiene que bajar, no toca otra, aunque hoy el mercado piense lo contrario…

Be Prepared for a Cheaper Dollar

When will the strong dollar weaken? Ultimately, the answer is whenever the Treasury wants.
When the Treasury is not overly concerned with the dollar, market forces can prevail to raise or lower the exchange rate compared with euros, Swiss francs, yen or any other currency.
Sometimes, other central banks intervene to raise or lower their currencies relative to the dollar and the U.S. does not seem to care. China is notorious for this. Japan and Switzerland are other practiced currency manipulators.
The last fully coordinated currency market intervention was conducted by the G-7 in March 2011 at the time of the Fukushima, Japan, earthquake and tsunami that caused the collapse of a nuclear power plant and ultimately a crash of the Tokyo stock exchange.
The Japanese economy was weakened by the natural disaster. A weaker yen would have helped the economy with cheaper exports and more inflation. But insurance companies had to sell dollar-denominated assets and buy yen in order to pay yen-denominated claims for the disaster losses. The result was a stronger yen.
The G-7 intervention, organized by then French Finance Minister Christine Lagarde, successfully sold yen and bought euros, dollars and sterling to weaken the yen despite insurance companies buying it. Lagarde’s success in this intervention was instrumental in her elevation to head of the IMF shortly thereafter.
In short, except in extraordinary circumstances, the U.S. Treasury does not directly intervene in currency markets to target U.S. dollar exchange rates. If such targeting is needed, the Treasury will work with the Fed to raise interest rates or take a pause in rate hikes to affect the dollar’s value.
All of this may be about to change.
Both President Trump and Treasury Secretary Mnuchin have publicly expressed dismay at the dollar’s persistent strength in the second half of 2018. A strong dollar has adverse effects relative to Trump’s economic plans.
It makes imports less expensive, which has a deflationary impact on the U.S. domestic economy. This is at a time when both the Fed and the White House would like to see more inflation.
A strong dollar also hurts U.S. exports from major companies such as Boeing and GE. That hurts U.S. competitiveness and U.S. jobs. Finally, a strong dollar hurts corporate profits of U.S. global companies because their overseas profits are translated back into fewer U.S. dollars. This is a head wind to U.S. stock market performance.
While the White House and Fed may be united in their desire to see a weaker dollar and more inflation, the Fed is doing nothing to achieve that. The Fed has been on a path of raising interest rates for almost three years, beginning with the “liftoff” rate hike in December 2015.
Since October 2017, the Fed has also been tightening money supply by not reinvesting in Treasury securities when existing securities in their portfolio mature. This “quantitative tightening,” or QT, is the opposite of quantitative easing, QE.
The combination of rate hikes and QT has caused a significant increase in U.S. interest rates in all maturities and, in turn, a stronger dollar as capital flows to the U.S. in search of higher yields. The result is a persistent strong dollar.
This means that if the White House and Treasury want a weaker dollar, they may have to achieve it on their own with no help from the Fed. The Treasury is well-equipped to do this kind of intervention by using their Exchange Stabilization Fund, or ESF.
The ESF was created under the Gold Reserve Act of 1934, which provided legal ratification for FDR’s confiscation of private gold from U.S. citizens in 1933. FDR paid $20.67 in paper money for the gold in 1933, knowing he intended to raise the price of gold.
His plan was to capture the “gold profits” for the government instead of allowing citizens to realize the profits. Those profits were the original source of funding for the ESF.
Importantly, the ESF exists completely outside of congressional control or oversight. It is tantamount to a Treasury slush fund that the Treasury can use as it sees fit to intervene in foreign exchange markets. No legislation or congressional appropriation is required.
Former Treasury Secretary Bob Rubin used the ESF to bail out Mexico in 1994 after Congress had refused to provide bailout money through other channels.
Today, the ESF has net assets of about $40 billion. The gross assets include about $50 billion in SDRs, but the Treasury can issue SDR certificates to the Fed in exchange for dollars if needed to conduct currency market operations. You can find the ESF financial statements here.
The biggest offender in the currency wars today is China, which has devalued the yuan 10% in the past six months to offset the impact of higher tariffs imposed by Trump. China’s cheap-yuan policy is undermining Trump’s trade war policies.
After biding their time, Trump and Mnuchin are ready to lower the boom on China with a cheap-dollar policy after the U.S. midterm elections. Of course, China will not be alone in feeling the impact of the new cheap dollar. Europe and the euro are also in the line of fire.
With this background in mind, what is the outlook for U.S. dollar exchange rates?
The single most important factor in the analysis is that two currencies cannot devalue against each other at the same time. It’s a mathematical impossibility. If one currency is going down against another, then the other must be going up. There’s no other way.
From January 2010 (when Obama launched the currency war) to August 2011 (when the dollar hit an all-time low), the currency wars benefited the U.S. at the expense of Europe, emerging markets and China. This was considered necessary by the participants at the G-20 leaders summit in Pittsburgh in September 2009.
The U.S. was and is the world’s largest economy. If the U.S. could not escape the impact of the 2008 financial panic, no one else would, either. In effect, the world would suffer stronger currencies while the U.S. devalued to jump-start the global recovery.
After August 2011, the dollar was allowed to revalue upward while the rest of the world, especially Europe and China, was allowed to devalue so they could claim some benefit from a weaker currency. This worked in the short run, but the problem was that the U.S. never returned to sustained growth at the prior trend of 3.25% growth per year.
The U.S. endured a long depression from 2007 until today with annual growth of about 2.3%. Europe and China got a boost, but the U.S. never pulled away from the pack.
Since then, it has been a matter of taking turns. The euro is allowed to depreciate to help growth and the banking system as the dollar gets stronger based on a slightly stronger U.S. economy. But no major economy has solved the problem of achieving self-sustaining trend growth.
China has been free-riding the entire time. There have been periods of a soft peg of the yuan to the dollar, but there are intermittent periods of a weaker yuan. China executed shock devaluations in August 2015 and December 2015.
Both times, U.S. stocks fell 11% in a matter of weeks. China has just executed a 10% slow-motion devaluation over the past six months. U.S. stocks have started to sink again.
Now Trump and Mnuchin are saying, “Enough!” The Europeans will have to take their turn with a stronger currency and China will be penalized for their currency manipulation. A weaker dollar is coming.
Whether this will be achieved with cooperation by the Fed or direct intervention by the Treasury remains to be seen, but a weaker dollar is the only way out of the U.S. growth conundrum and debt debacle.
The chart below shows that the euro has settled into a trading range since April after coming down from the $1.25 range in February.
Chart 1:
The euro will break out of that trading range toward the upside ($1.20–1.30) over the next few months. This will be the result of a possible Fed pause in rate hikes as the U.S. economy weakens, continued determination by the ECB to tighten policy and possible intervention by the U.S. Treasury.
Meanwhile, a weaker dollar will give the U.S. another growth spurt after the 2018 tax cuts to help propel Trump’s reelection prospects for 2020.
Abrazos,
PD1: Lo fácil aburre, lo difícil atrae, lo complicado seduce y lo imposible enamora. En la vida espiritual pasa un poco de lo mismo. Rezar el Rosario a veces aburre. Hay que buscar artimañas para salir de la repetición (cambiar entonación en una palabra, poner una intención en cada ave maría…). La oración mental muchas veces es muy difícil, hay mucho ruido fuera, y muchas cosas dentro. Pero cuando te habitúas a ella, te seduce y no puedes dejar de estar en oración un buen rato cada día con el Señor, acabar enamorado de Dios, poniendo un poco de esfuerzo y perseverancia. No, no es un imposible, sino algo muy alcanzable…

05 noviembre 2018

los costes a futuro de la expansión actual de la deuda pública serán insostenibles

No va a haber quién pague esto cuando los tipos suban, que subirán…

Efecto gradual

La deuda pública española, medida en euros, se ha multiplicado por tres en los últimos diez años. Sería lógico pensar que, a mayor nivel de deuda, mayor habrá sido el tipo de interés exigido por los inversores para la nueva deuda. Pues no ha sido así. A pesar del pronunciado incremento de deuda, el Tesoro español ha logrado emitir a un tipo más reducido cada año respecto al año anterior en los últimos ocho ejercicios. En 2007 con una deuda pública de apenas 300.000 millones de euros el Tesoro emitía deuda nueva a un tipo del 4,2%. En 2018, con una deuda que supera el billón de euros, logra emitir pagando sólo 0,7% de tipo de interés, seis veces menos que hace una década.
La tentación de cualquier gobierno de considerar que el menor coste de financiación de la deuda nueva responde a la confianza de los inversores en su gestión es casi irresistible. En realidad, el principal causante de esta situación de los tipos de los bonos ha sido el BCE, con su actuación en el mercado, distorsionando los tipos de interés que exigiría cualquier inversor en un mercado no intervenido.  
La finalización del programa de compra de bonos por parte del BCE el próximo diciembre tendrá un efecto apreciable en el mercado de deuda pública. Los tipos de interés exigidos por los inversores subirán, pero el efecto sobre el coste total de la deuda será gradual. Afortunadamente, la actuación del BCE ha sido aprovechada por el Tesoro español para alargar el vencimiento medio de la deuda viva. Así, la vida media de la deuda ha pasado de 6,2 años a 7,5 años. Por tanto, de media, cada año el Tesoro tiene que financiar un 13,3% del total de la deuda viva. El incremento del coste financiero se dejará sentir en las emisiones realizadas para renovar los bonos que vencen y, por supuesto, en la deuda nueva necesaria para financiar el déficit de cada año, pero el aumento del coste financiero medio será gradual.
Aunque el tipo medio de emisión de la deuda española se haya reducido a la sexta parte entre 2007 y 2018, del 4,2% a apenas 0,7%, el coste medio de la deuda viva "sólo" se ha reducido del 4,5% al 2,4% en el mismo periodo.
La subida de los costes de emisión de la deuda púbica no es una buena noticia, pero su efecto se materializará en las nuevas emisiones, no en las antiguas. En cualquier caso, la alegría con la que los gobiernos de la Eurozona han incurrido en reiterados déficits, sin que el vertiginoso aumento de la deuda pública les haya supuesto tener que pagar tipos de interés acordes al nivel de deuda, llega a su fin.
Han sido muchos años en los que la certeza del respaldo del BCE ha minusvalorado las consecuencias adversas de la generación de nueva deuda. A partir de ahora los inversores serán más exigentes y los gobiernos deberán ser más prudentes en sus políticas fiscales. Pese a todo, no es descartable en absoluto que el BCE vuelva a intervenir en el mercado de bonos en un horizonte no lejano en el tiempo. La vuelta a la normalidad monetaria no se presenta sencilla.
Abrazos,
Jason Evert y Crystalina Padilla son dos novios que explican de forma sencilla sus razones para vivir la castidad, sin ningún complejo delante de las cámaras. Con su sesión “Amor sin Remordimiento” consiguen cautivar al público adolescente. Os recomendamos especialmente que entréis en su web y le echéis un ojo a las argumentaciones acerca de la castidad.
Te dejo el vídeo subtitulado y doblado en castellano para que te sea más fácil seguirlo: https://www.youtube.com/watch?time_continue=3&v=In2ZccckIy4

02 noviembre 2018

¿Se subestima el poder económico de China?

La economía China es mucho más poderosa de lo que nos podemos imaginar. Pocos escriben sobre China, salvo para decir aberraciones. Me ha gustado mucho esto:

Why So Many Underestimate China’s True Economic Power

China’s economy is so large – and growing so rapidly – that it’s difficult to get a true read on the size of its influence on the world stage, according to this opinion piece by David Erickson, a senior fellow and lecturer in finance at Wharton. Before he taught at Wharton, Erickson was on Wall Street for more than 25 years, working with private and public companies to raise equity strategically.
Some of the rhetoric out of Washington recently has been suggesting that the U.S. is “winning” the trade war because the U.S. stock market is near all-time highs as China’s domestic equity markets have declined significantly. While the domestic Chinese equity markets have suffered since the trade tensions started earlier this year, I think that premise underestimates the economic power of the rapidly growing number-two economy in the world and really needs a bit of context.
The Chinese equity stock market — as represented by Shanghai stock market — actually peaked in 2015. This is not too dissimilar from the market cycles we have experienced in the U.S. in the last 20 years. This includes what we saw in the Dow Jones Industrial Average (DJIA), which reached 11,000 in May of 1999 but took more than seven years to reach 12,000. While the DJIA advanced from October 2006 to July 2007 from 12,000 to 14,000, it took almost six years, until May 7, 2013, before it advanced to the 15,000 milestone. For the NASDAQ market, the cycle was even more dramatic where it took 15 years to reach new highs in 2015. Markets do go through cycles.
But hasn’t the Shanghai stock market been quite volatile since the trade war started? Yes, it has. This is not surprising with much of the domestic Chinese equity market activity largely being from retail investors, especially with many having very limited experience in Chinese equity investing (which I will address shortly). With the uncertainty of the trade rhetoric over the last few months, there was likely to be some significant volatility. However, by way of comparison, the U.S. equity markets went through significant volatility earlier this year after a significant run since the 2016 U.S. election. If you go back a bit further, the U.S. equity markets, which are largely institutionally driven, had significant periods of volatility during the 2008 Financial Crisis, where the DJIA fell almost 800 points on September 29th; the technology “bubble” in 2000, where on April 14th the NASDAQ fell 9% and for the week 25% (and the NASDAQ 100 index lost 78% of its value in two years); and when the Dow Jones fell almost 23% in one day on “Black Monday” of 1987.
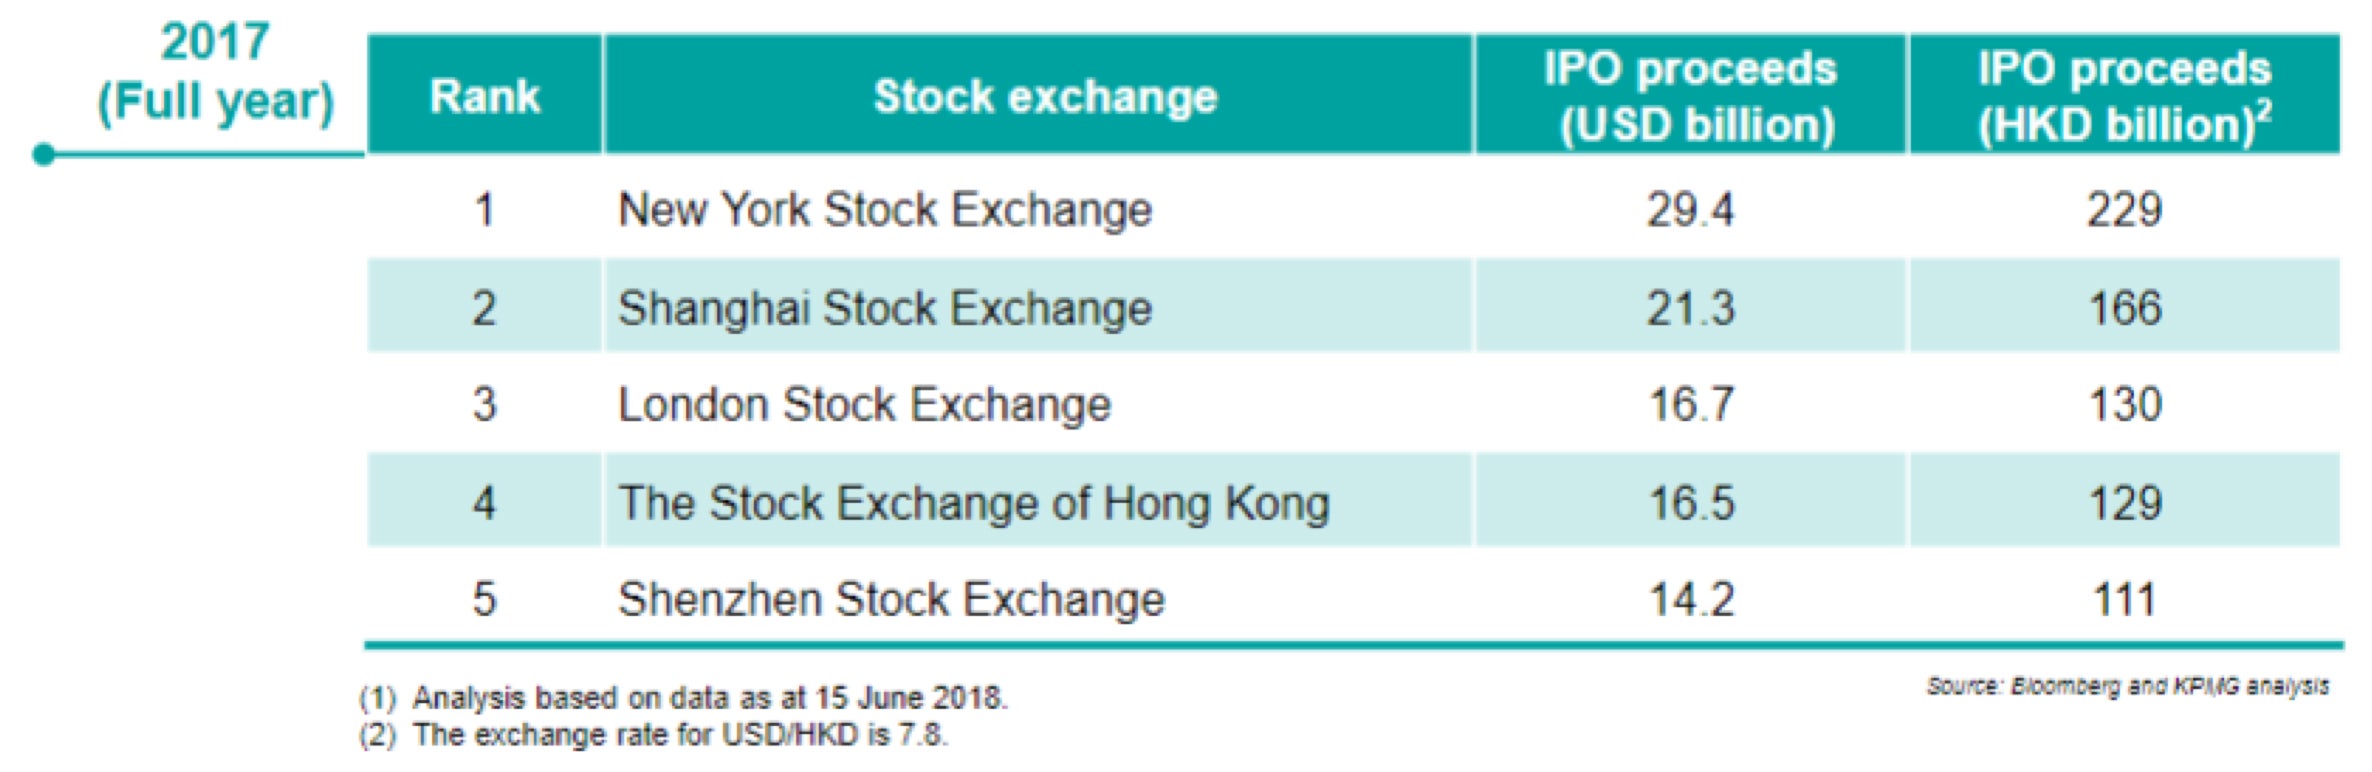
Why do I go back to 1987 for context? Because in 1987, while a Wharton finance student could study “Black Monday” in the context of previous crashes in the U.S. stock market, the Chinese domestic equity market didn’t exist and wouldn’t until 1990. That’s right, a Chinese student studying finance on mainland China at the same time couldn’t learn about investing in the Chinese equity markets because it did not exist until a few years later. The Shanghai Stock Exchange was founded in 1990 (and Shenzhen around a similar time) creating a domestic equity market for both mainland Chinese companies to list and finance, and for Chinese institutions to invest. Today, it is estimated that the Shanghai Stock Exchange has over 200 million retail investors — total U.S. population is just 327 million — and for the full year 2017 was the number-two IPO market globally in terms of proceeds raised. So, while the Chinese equity market has suffered significant losses this year, given the “rapidity” of its evolution, these changes need to be put in context.
“Now, markets in Hong Kong, Shanghai and Shenzhen collectively represent the largest IPO market in the world….”
These are just a couple of the things we learned on our recent trip to Hong Kong, Shanghai and Shenzhen as part of Wharton’s MBA course called Strategically Investing in the Growth of China. A delegation of 58 Wharton Executive MBA students, along with three faculty members, met with prominent Chinese companies, leading Chinese public equity and private equity investors, as well as representatives of the Hong Kong and Shanghai Stock Exchanges, and explored how they strategically invest in the growth of China. While I had been to China many times during my previous investment banking career (though the last time was in 2013 before I retired), about 85% of our students had never been to Hong Kong or mainland China.
When we started our trip, given that many of our students had never been before, I wanted to give them a few numbers to provide some context as to the size and scope of the Chinese economic opportunity. Here are some of them — all approximations:
+a population of 1.4 billion people;
+400 million in the middle class.
And to get some sense of the rapidity of the change:
+Exports have grown for the last 30 years at a 17% compound annual growth rate (CAGR), making China the world’s largest exporter at $2.3 trillion in 2015, according to The China Questions – Critical Insights into the Rising Power;
+In 1980 about 70% of Chinese labor force was in agriculture; by 2016 only 30% was in agriculture;
+In 1980 only 2% were university educated; by 2016, approximately 30%;
+In 1980 Shenzhen had a population of 30,000; by 2016, Shenzhen had a population of some 12 million.
What I realized as we progressed through our visits to these companies and investors was that these numbers were understated, and significantly under-estimate the economic power of China. Let me outline three of the specific attributes that we learned about and discussed as part of our trip:
Capital Formation – the World’s Largest Equity-raising Market
When I first came to China as a 34-year-old investment banker in 1998, I flew to Beijing to pitch a Chinese tech company looking to raise about $100 million in an IPO. Back then, for a $100 million tech IPO, really the only game in town was the U.S. NASDAQ market.
Back in 1998, as companies from emerging countries (e.g., Brazil, China, India, Russia) started to go public, with local currency restrictions and liquidity constraints — as well as other challenges, such as a lack of international investors — there were three or four markets that attracted the bulk of the international listings – London, Hong Kong, New York/NASDAQ and Tokyo. For most companies from emerging countries in Europe, the Middle East and Africa, London was the preference; for most companies from emerging countries in Asia and Latin America, New York/NASDAQ was the preference. NASDAQ, until probably 2014 when Alibaba went public on the NYSE, was the market where most growth companies globally went to list.
Things have changed dramatically in the last 20 years.
Now, markets in Hong Kong, Shanghai and Shenzhen collectively represent the largest IPO market in the world as can be seen in the chart below from KPMG’s “Mainland China and HK 2018 Mid-Year Review: IPOs and Other Market Trends.”
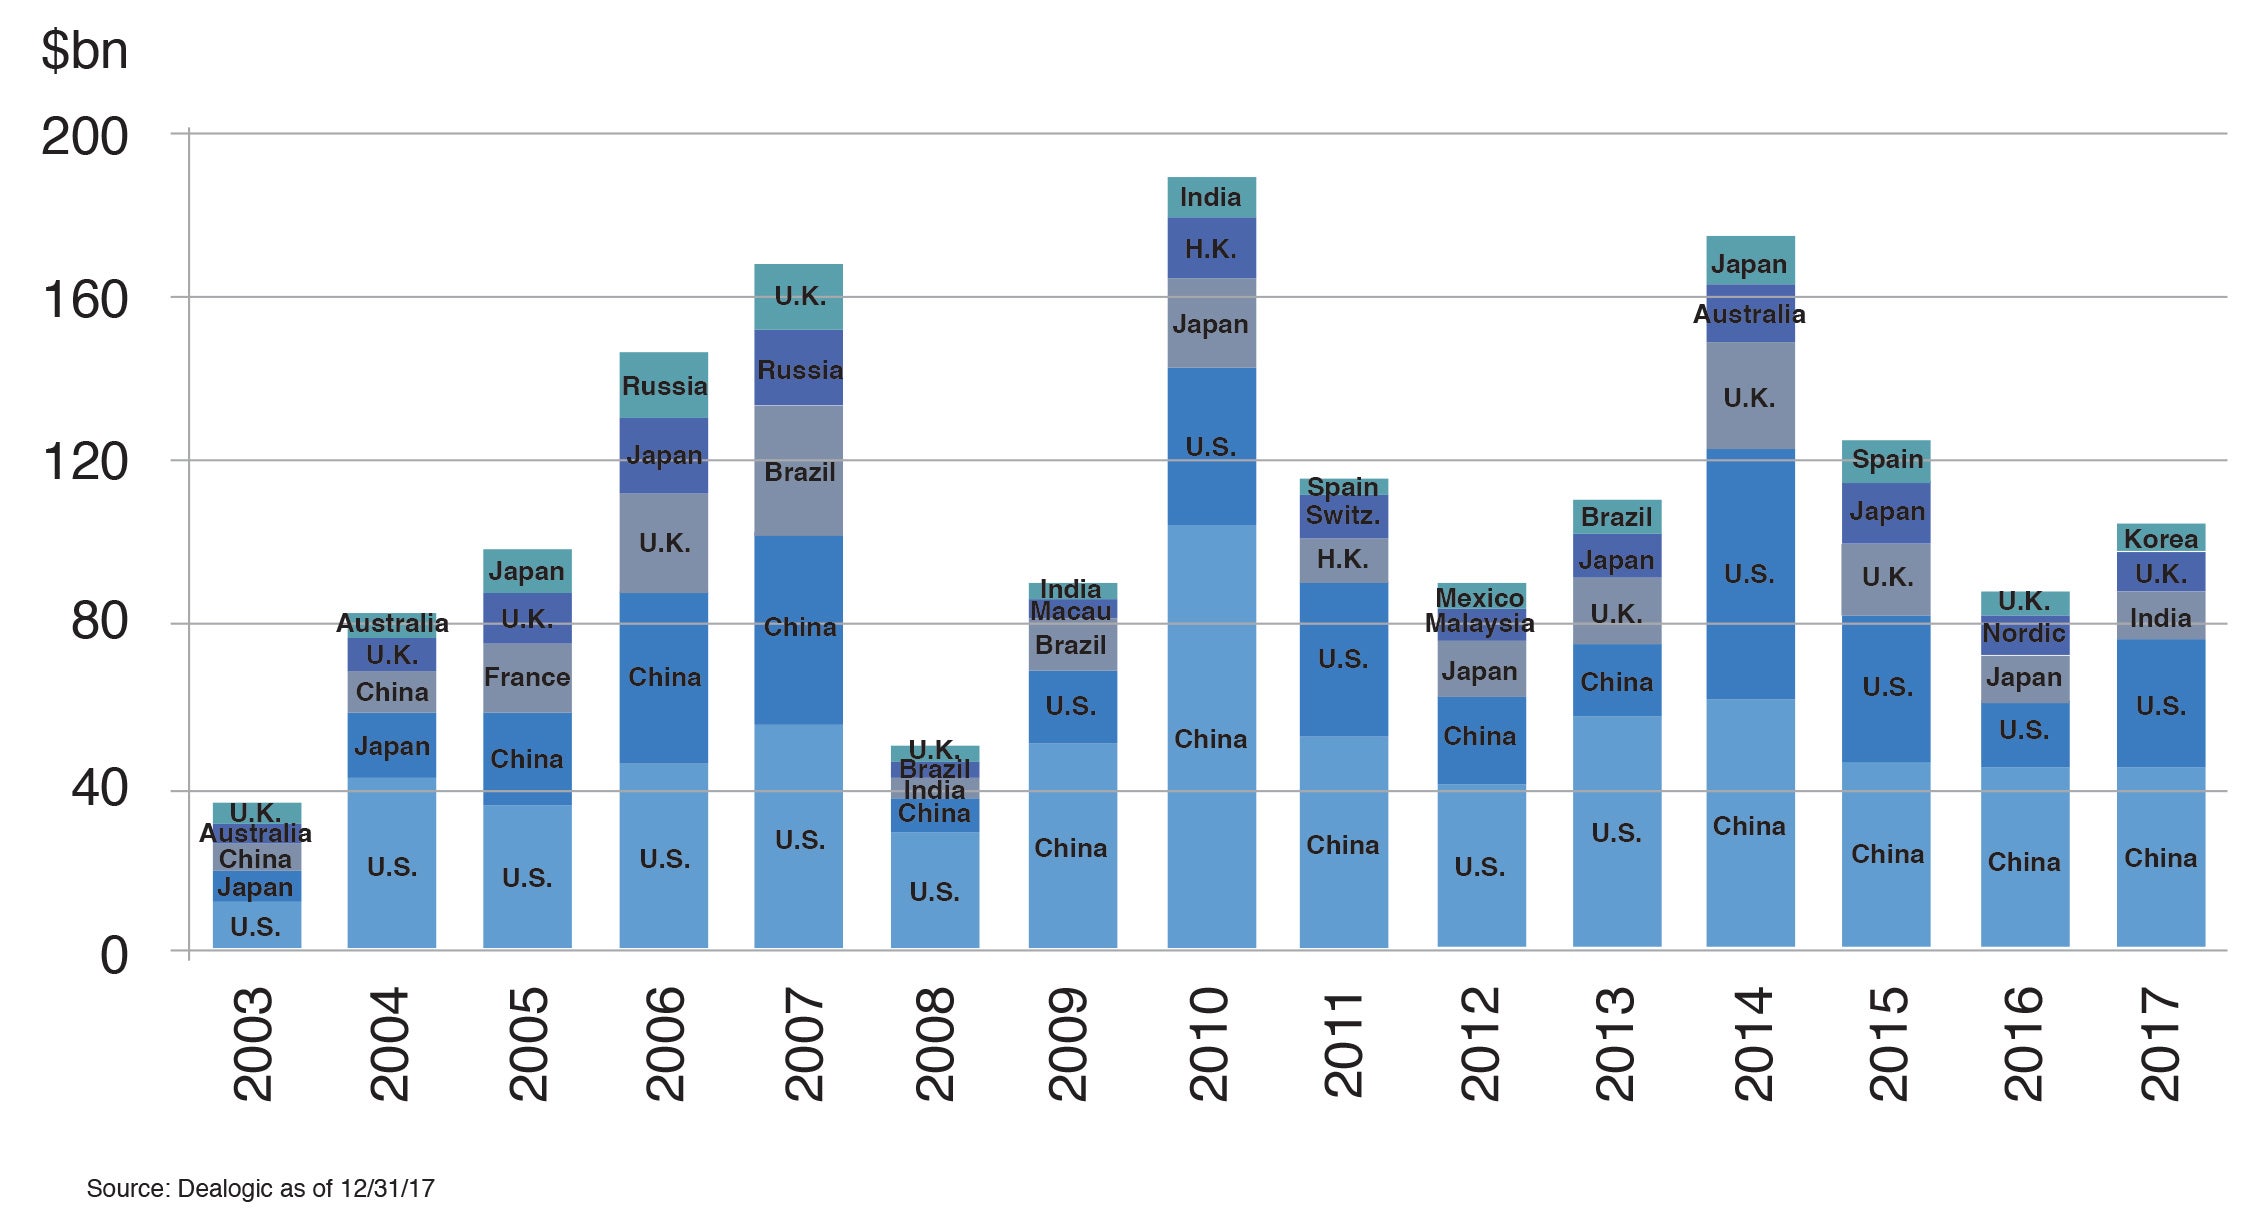
To give another perspective, the second graph below, via Barclays, shows the 15-year trend (203-2017) of the top five countries by issuer nationality with the most IPO volume. Since 2008, Chinese companies — versus those from any other country — have collectively raised the most IPO capital in seven of the last 10 years. What has changed over this 15-year timeframe is that most of Chinese activity prior to 2008 was the capital raising for state owned enterprises (SOEs), while activity post-2008 is for more traditional privately owned companies. The high water mark for Chinese IPO capital formation was 2010 when there was a combination of factors that drove this activity.
2003–2017 Global IPOs
Top 5 Countries (By Issuer Nationality)
The third chart below is from a report by Siguler Guff, one of the earliest Chinese private equity fund of funds, estimating that only 35% of China’s GDP in 2016 was represented in public equity market capitalization (versus in the U.S. at 143%). This gives you a sense of why we might be in the very early stages of this Chinese capital raising trend:
Stock Market Capitalizations Relative to GDP in 2016
In addition to public equity capital formation, companies in China also receive a significant portion of the private equity capital globally. Estimates by Bain & Company in their 2018 Asia-Pacific Private Equity Report suggest that approximately $73 billion was invested in greater China in 2017 by private equity firms — almost half of the capital invested across the Asia-Pacific region.
Not only is there significant capital being deployed by the leading private equity firms globally, but also by some of China’s largest companies — such as Alibaba and Tencent. Estimates suggest Tencent has invested over $30 billion since 2015. While some of this investment has been in international companies such as Tesla, Spotify and Snap, Tencent has also been a significant investor in China, notably in 13 Chinese multi-billion-dollar companies that have gone public since the beginning of 2017, including Meituan Dianping, which has just raised over $4 billion. Tencent owns about 20% of the company. In three of those big companies, Tencent had major stakes of 40% or greater – China Literature, SEA and Sogou. Tencent also announced earlier this year that wholly owned Tencent Music will list in the U.S. Alibaba, meanwhile, has also made many significant investments, including as the largest shareholder of Ant Financial, which recently raised about $14 billion, called the largest single fundraising globally by a private equity company. Alibaba owns about a third of the company, rumored to be valued at $150 billion.
While China’s leadership in IPO capital raised over the last several years could change if trade tensions with U.S. become prolonged, the demand from private equity capital firms and Chinese corporations is likely to continue, and may increase — as we have seen in the U.S. in recent years — if IPO activity lessens.
Innovation – Developing the World’s Biggest e-Payment Market
One of what may be China’s best economic secrets is that it is home to not one, but two of the most powerful e-payment platforms globally. Ant Financial’s Alipay and Tencent’s WePay are estimated to each have more than 500 million active users. Trying to provide comparison to the U.S. market is difficult, but it is quite clear that the e-payment market in the U.S. is just a fraction of China’s. Two metrics providing some context are that, according to Statista, PayPal, the largest U.S. comparable platform company, has 244 million active users globally; and the U.S. banking system overall is expected to have 161.6 million digital banking users by next year.
“BCG in its 2018 Global Wealth Report estimated that China represents approximately 15% of the upper net worth and ultra high net worth individuals (HNWIs) in the world.”
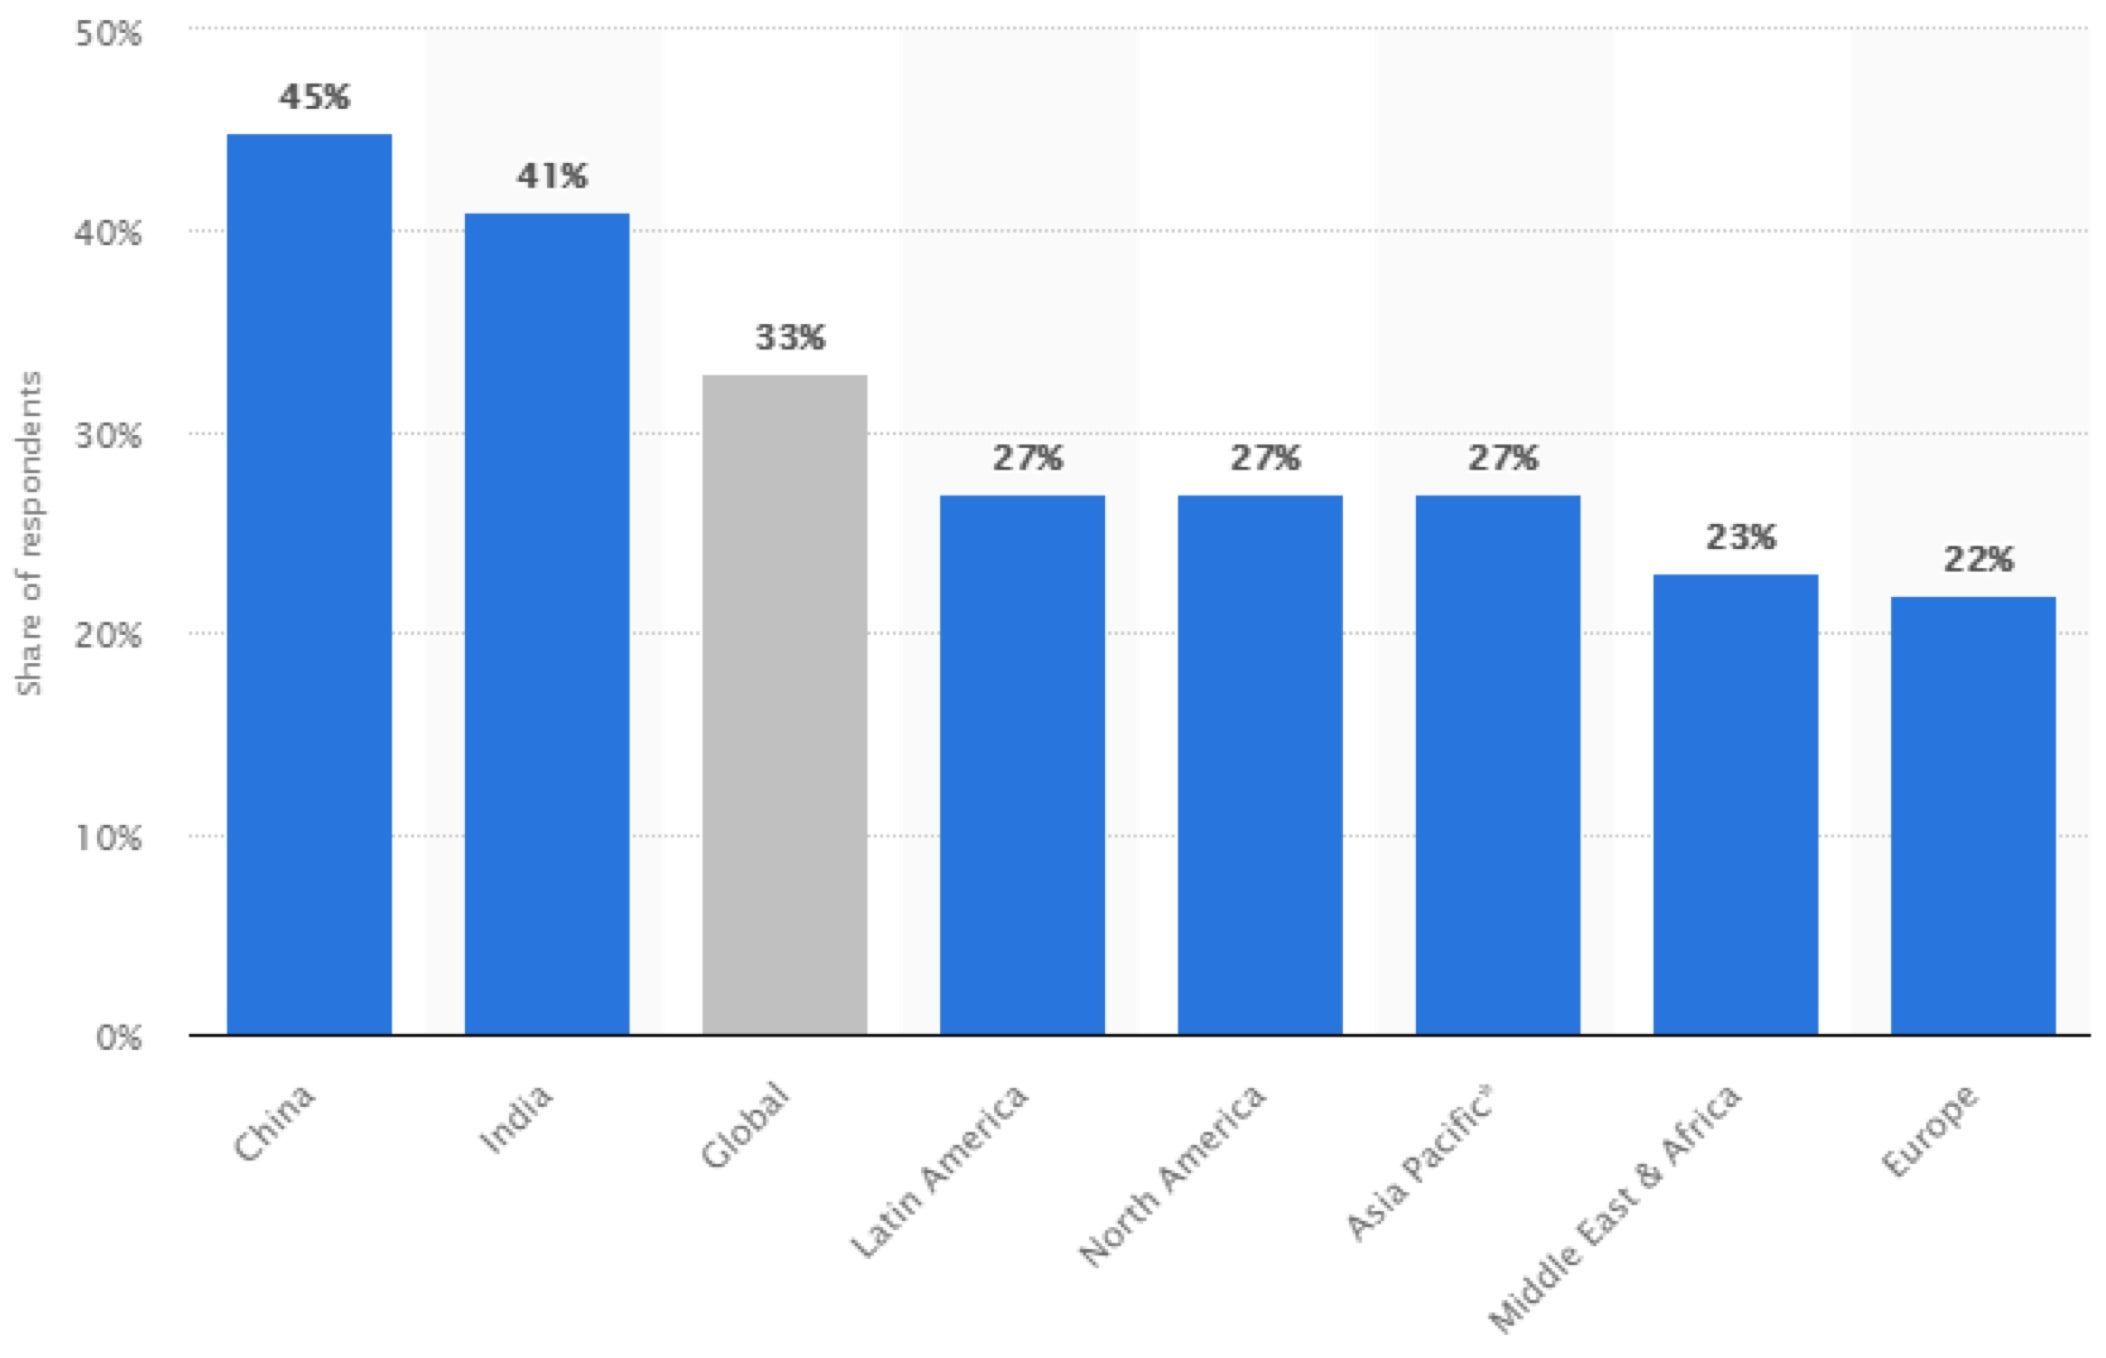
While Tencent’s WePay is largely linked to WeChat, Tencent’s dominant messaging service, Alipay, has been quite visibly building partnerships outside of China especially in Southeast Asia. With the Chinese mobile payment market estimated at approximately $5.5 trillion in 2016 and with 45% penetration of Chinese internet users (as seen in the chart below from Statista), China is clearly the biggest e-payment market in the world.
Share of Internet Users Worldwide Who Used a Mobile Payment Service in the Last Month as of Third Quarter 2017, by Region
Given this tremendous opportunity for Ant Financial, one of the discussions on our trip was with a panel of public equity institutional investors that target China about whether in the long-term, Ant Financial would exceed the value of Alibaba, its founding shareholder that spun what was then Alipay off to shareholders in 2011. With the ability to potentially be the e-payment platform in international markets where e-wallets are prevalent but technology is lacking — such as in Africa, the Middle East, Latin America and Southeast Asia — the potential thesis is that Ant has a tremendous opportunity with limited international competition versus Alibaba, which has largely been limited to China, and has the challenge of Amazon and other competitors internationally.
Wealth Creation – World’s Fastest-growing Market
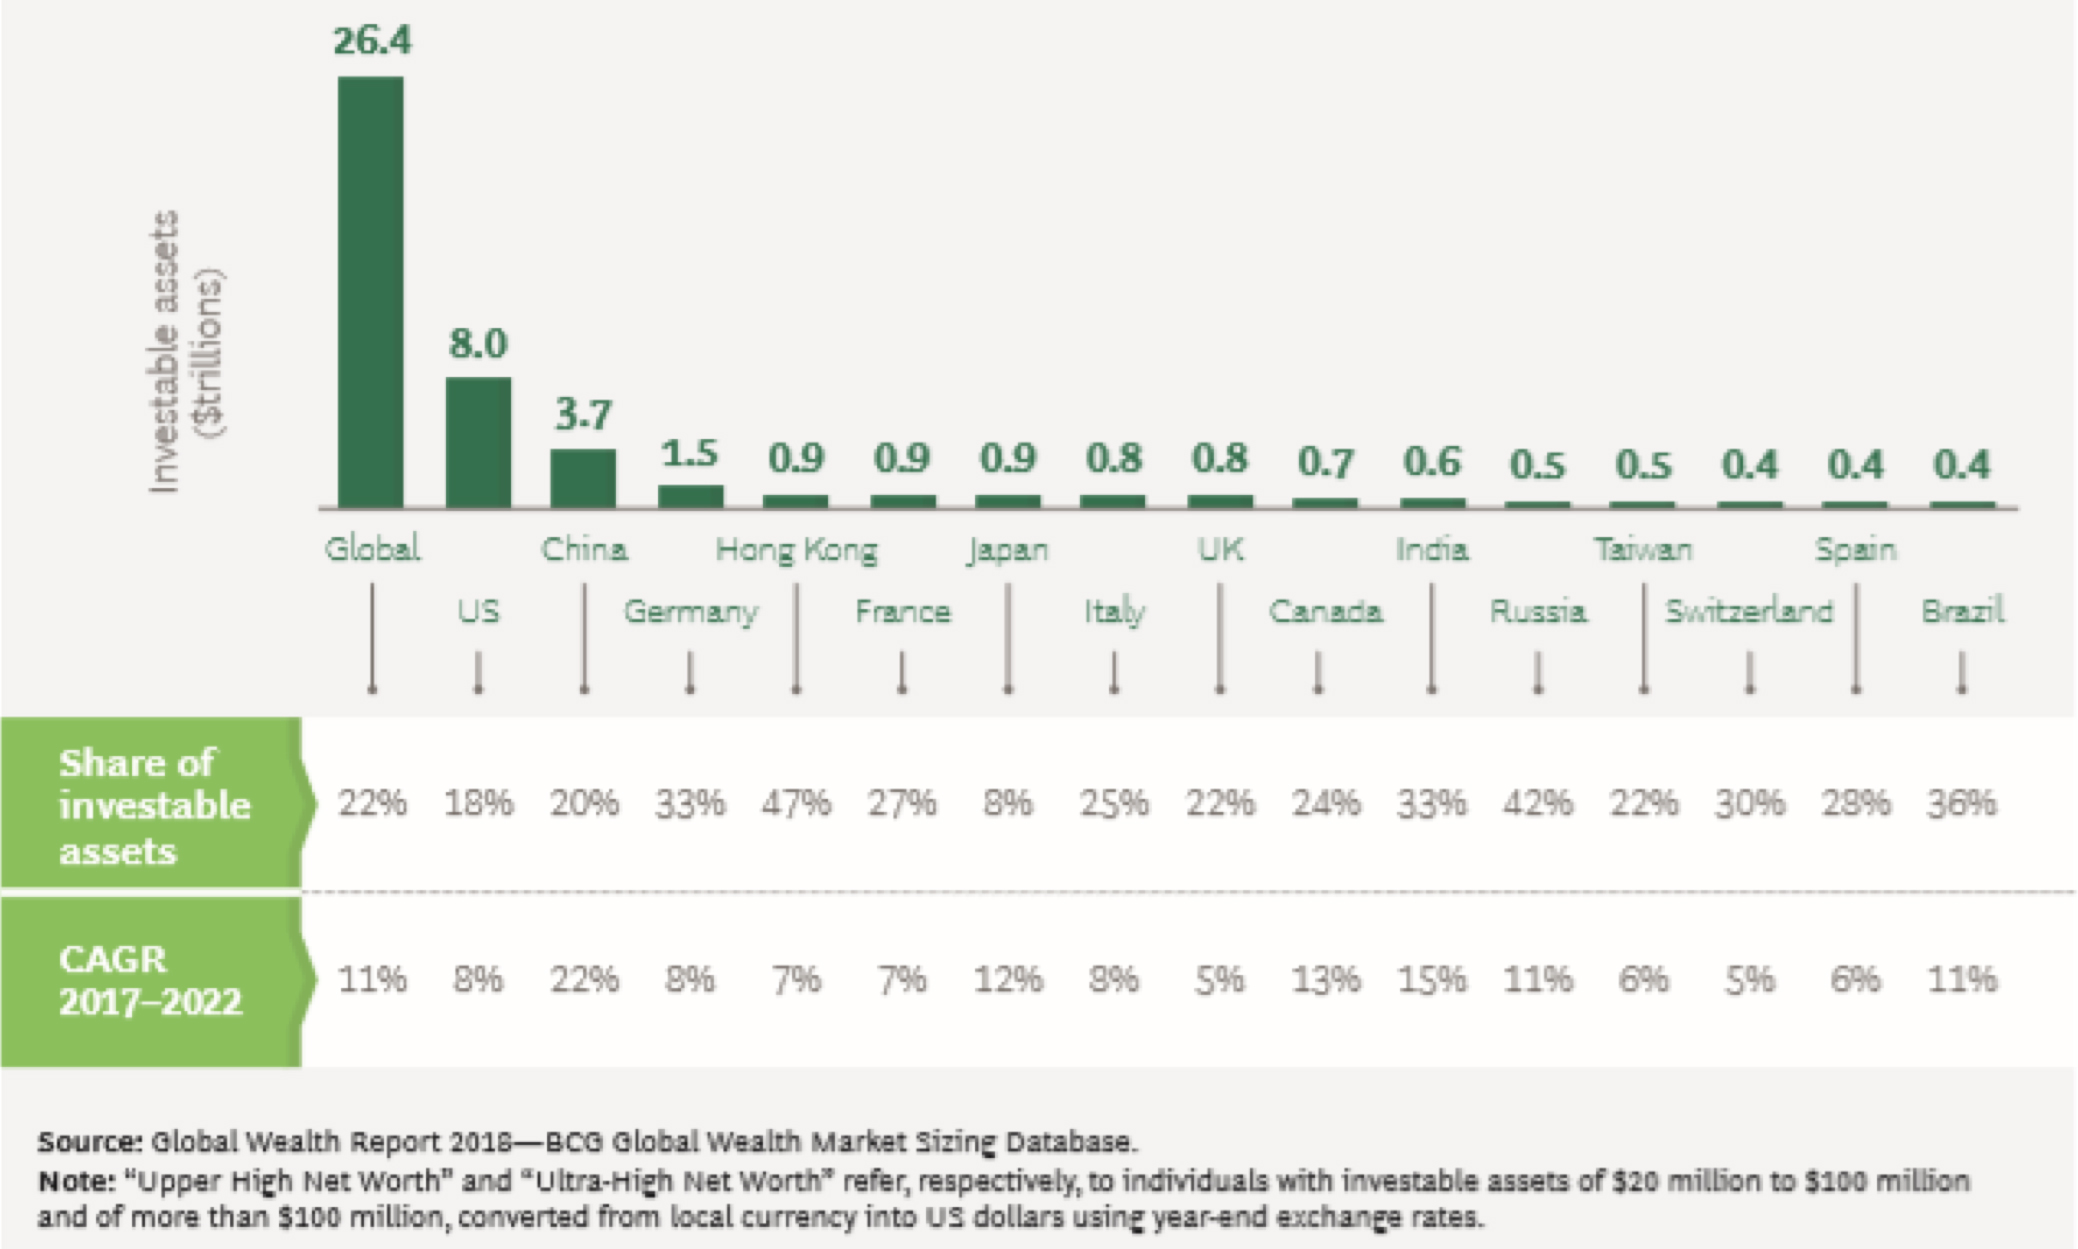
BCG in its 2018 Global Wealth Report estimated that China represents some 15% of the upper high net worth and ultra high net worth individuals (HNWIs) in the world, and that those groups are growing at a 22% CAGR. BCG defined personal wealth for upper HNWIs as being greater than $20 million but less than $100 million, and ultra HNWIs as having wealth than $100 million.
As shown in the chart below from BCG’s report:
The U.S. Holds More Than 30% of the World’s Upper High Net Worth and Ultra High Net Worth Wealth
If you add up the numbers for greater China, including Hong Kong and Taiwan, the investable assets for upper- and ultra high net worth individuals represent more than $5 trillion dollars. This, coupled with the approximately 400 million people characterized as the Chinese middle class, creates a significant source of wealth potentially as the Chinese economy matures. This is why Chinese wealth management is considered one of the biggest opportunities in financial services globally. This opportunity, like many in China, is in its early stages with both product development and regulation. Recent issues with companies like the Anbang Insurance Group, the Chinese insurance company that grew its wealth management business significantly and was seized by the government earlier this year, has caused the Chinese government to step up its involvement in regulating this sector.
Potential Issues
While the three attributes presented show how China’s economic power is likely being underestimated, there are also potential issues besides the ongoing trade tensions:
The ability for the governmental framework to support the rapidity of the evolution and innovation of the Chinese economy. Of the three attributes examined, all have largely developed in the last two decades. Given this rapid development, does the Chinese government have the knowledge and ability to regulate and support? While any government’s regulatory framework would be tested by the rapidity of this evolution, China, unlike most major economies globally, was largely not impacted and its systems were untested by the Global Financial Crisis 10 years ago. One of the reasons the Chinese financial system and the major Chinese state-owned enterprise banks were largely unaffected is they had just been capitalized with public equity capital in the years leading up to 2008. Also, these banks had not yet expanded their activities internationally.
“… If other governments internationally are potentially uncomfortable with a company like Ant being the e-payment platform … significantly changes Ant’s opportunity internationally….”
One specific concern stated frequently is the size of the Chinese shadow banking system. While the phrase is often assumed to be negative, it is not. Shadow banking exists in most markets globally, including in the U.S., and refers to banking activities that occur outside the regulated banking sector. Because these activities happen outside the regulatory framework, there is often less disclosure and information available. Entities like corporations, non-bank financial companies, pension funds and other institutions often engage in these activities, for example lending, to improve their returns. Also, with recent developments in China regarding investing vehicles for individuals like peer-to peer lending, concerns have heightened. These concerns often have to do with two primary things: the relative size of the shadow banking system versus the regulated banking system; and the lack of disclosure/transparency often affiliated with activities in China increases the anxiety.
The possibility of government(s) intervening to curtail or stop some of the innovation in China’s economy. Notice that “government” above potentially is not just limited to Chinese government intervention. For China specifically, the recent announcement that video game rules would be put in place significantly impacts Tencent, with gaming being its largest business. In terms of international government involvement, the U.S. Committee on Foreign Investment in the U.S. (CFIUS) earlier this year blocked the acquisition of MoneyGram by Ant Financial for national security reasons — an example of what forces could limit some of the innovation and success as companies look to expand outside of China. Similarly, if other governments internationally are potentially uncomfortable with a company like Ant being the e-payment platform — or partnering — in their country, it significantly changes Ant’s opportunity internationally, as well as potentially the long-term investment thesis.
Abrazos,
PD1: Hay muchos que están más cerca del Reino de Dios de lo que pensamos, porque hacen cosas muy buenas... Como dijo santa Teresita del Niño Jesús: «El Señor no me podrá premiar según mis obras (...). Pues bien, yo confío en que me premiará según las suyas». Menos compararnos con los demás, menos juzgarles, y más valorar lo bueno de cada uno.