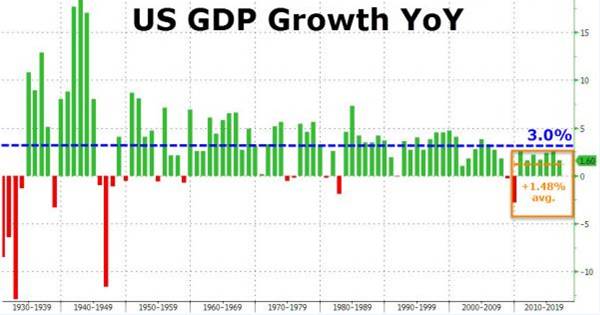
EEUU ya no crece como lo hiciera antes:
La media desde 2010 es del 1,48%, lejos del 3% de media que tuvo muchos años, y muy lejos de cuando era emergentes y crecían una barbaridad…
Año a año, el crecimiento económico se va desacelerando inexcusablemente… ¿Por qué?
Es un problema de productividad baja y de capacidad excesiva…:
Why Does Economic Growth Keep Slowing Down?
The U.S. economy expanded by 1.6 percent in 2016, as measured by real gross domestic product (GDP). Real GDP has averaged 2.1 percent growth per year since the end of the last recession, which is significantly smaller than the average over the postwar period (about 3 percent per year).
These lower growth rates could in part be explained by a slowdown in productivity growth and a decline in factor utilization.1However, demographic factors and attitudes toward the labor market may also have played significant roles.
The figure below shows a measure of long-run trends in economic activity. It displays the average annual growth rate over the preceding 40 quarters (10 years) for the period 1955 through 2016. (Hence, the first observation in the graph is the first quarter of 1965, and the last is the fourth quarter of 2016.)
Long-run growth rates were high until the mid-1970s. Then, they quickly declined and leveled off at around 3 percent per year for the following three decades.
In the second half of the 2000s, around the last recession, growth contracted again sharply and has been declining ever since. The 10-year average growth rate as of the fourth quarter of 2016 was only 1.3 percent per year.
Total output grows because the economy is more productive and capital is accumulated, but also because the population increases over time. The next figure compares long-run growth rates of real GDP and real GDP per capita. Both series display similar behavior.
Although population growth has been slowing, the effect is not big enough to change the qualitative results described above.
The third figure adds long-run growth rates of real GDP divided by the labor force.2Dividing by the labor force instead of the total population accounts for the effects of changing demographics and labor market attachment.
From the 1970s until the 2000s, long-run growth rates of real GDP divided by the labor force remained well below those of real GDP per capita. There are two main factors that explain this:
+ Lower fertility and longer lifespans steadily increased the potential labor force relative to the total population.
+ Labor force participation increased significantly from the 1960s until 2000, largely driven by increased female labor force participation.
When accounting for both of these factors, economic activity from 1975 to 1985 looks more depressed than in the two decades that followed. This seems consistent with the negative effects that the 1970s oil shocks and efforts to reduce inflation in the early 1980s3had on the economy.
The trend in labor force participation reversed in 2000, as participation rates have been steadily decreasing since then. This explains why real GDP divided by labor force growth rates are now higher than real GDP per capita growth rates.
Having accounted for the long-term effects of changes in demographics and labor market attitudes, we can now look at the effects of productivity growth and factor utilization. The final figure compares long-run growth rates in real GDP divided by the labor force with long-run growth rates in total factor productivity and long-run averages of capacity utilization (i.e., the actual use of installed capital relative to potential use).4 Note that data for capacity utilization are only available since 1967.
The poor long-run performance of 1975-1985 can be attributed to low productivity growth and a decline in capacity utilization. Afterwards, long-run growth rates in output started to pick up, first associated with an increase in capacity utilization and then with increased productivity growth.
The current path of decline in output growth follows from both a slowdown in productivity growth and lower capacity utilization, though the latter factor started earlier and may have leveled off sooner.
Notes and References
1 As argued by St. Louis Fed President James Bullard, we seem to be currently in a low productivity-growth regime. See Bullard, James. “The St. Louis Fed’s New Characterization of the Outlook for the U.S. Economy,” announcement, June 17, 2016.
2 The labor force includes all persons classified as employed or unemployed in the Bureau of Labor Statistics’ Current Population Survey.
3 For more on the monetary policy actions of the early 1980s, see Medley, Bill. “Volcker’s Announcement of Anti-Inflation Measures,” Federal Reserve History, November 22nd, 2013.
4 The series for total factor productivity is taken from the Federal Reserve Bank of San Francisco. Capacity utilization is published by the Federal Reserve’s Board of Governors and covers only the industrial sector of the economy (manufacturing, mining, utilities and selected high-tech industries).
Abrazos,
PD1: Salvo el crash de 1987, todos los periodos bajistas de la bolsa (bear markets) tuvieron que ver con etapas recesivas de su economía…
Por eso en estos días no hay sensación de que las bolsas vayan a desplomarse; tendrán alguna corrección puntual simplemente, ya que el crecimiento económico sigue flojo, pero sigue…
La gran duda de si las bolsas están caras o baratas:
Unas más caras que otras… Por eso, en estos días, se está mucho más tranquilo en las bolsas emergentes…
PD2: Hoy empieza la Cuaresma. ¿Algo habrá que hacer? Mira que buenos consejos:
Pero el ideal es que te pongas un buen propósito y que lo hagas. No sólo puede ser no beber cerveza estos 40 días, o ayunar ni comer carne, que, como la limosna al necesitado, es obligado hoy, sino además algo bueno que noten los demás: mucha alegría, tratar mucho mejor a los de nuestro entorno, hablarles de Dios…, ser mejor persona.


