25 mayo 2017

china

A esto es a lo que se está enfrentando China:

China's Trilemma

I was recently honored to participate in a China economic forum at the University of Chicago, my alma mater. The event was held in the building where my wife and I had our first date. In my opening comments, I expressed the wish that the location of the event would be a good omen for long, positive relations between the two countries.
That wish certainly seemed to be shared by those in attendance. But relations between the world’s two largest economies have become more complicated recently, and not solely because of regime change in Washington. Ultimately, the fortunes of China and America are closely intertwined. It would be difficult to foresee success for one at the expense of the other. 
On the surface, China continues to outperform expectations. It has sustained a high rate of economic growth for longer than most other developing countries. China has come to dominate markets for many commodities, has lifted 500 million people out of poverty in the last 35 years, and its One Belt One Road project aims to spend trillions on infrastructure across 65 countries. With the United States pulling back somewhat from international engagement, China has projected itself as the world’s leading proponent of globalization. 
China’s progress has, at least on the surface, been remarkably steady. It isn’t uncommon for emerging economies to have a setback or two on the way to prosperity; development can be haphazard as markets and institutions mature. China, however, learned from the examples of its neighbors, and has managed its growth very carefully. 
 
Among the lessons China took closest to heart was to open up slowly. Nations that release market influences and accept international capital flows too soon can experience volatility that is damaging to nascent economic structures. China has limited the influence of these forces and built substantial reserves as another bulwark against financial instability. 
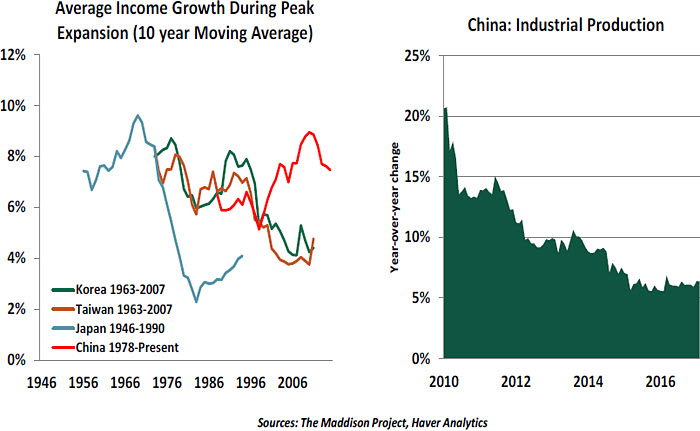
China’s progress has to a large degree been made on the back of manufacturing and exports. But in recent years, this sector has been challenged by sharp competition from other countries (many of them China’s regional neighbors) and slow global demand. The growth of industrial output in China has slowed and the amount of overcapacity has risen.
The Great Transition
To compensate, China has expressed the wish to see its service sector take the lead in the coming years. China has generated a lot of wealth for its citizens, and they are spending more of it. For the past three years, Chinese consumption has grown faster than manufacturing. 
 
But the Chinese service sector represents only about 45% of the country’s gross domestic product (GDP), a level well below that of developed nations in the West. Part of the reason is that consumer credit is not nearly as well developed in China (which may be a good thing for them), but another is a cultural frugality born of hard times and perpetuated by demography. 
Because of its one child policy (and because China is not the easiest country to emigrate to), China’s population is collectively aging more rapidly than any other nation’s. The World Bank estimates that the ratio of workers to retirees in China, which currently stands at around 8, will fall to just two by the year 2050. This will place a natural limit on economic growth and could present challenges for the country’s retirement systems. In anticipation, the Organization for Economic Cooperation and Development estimates that Chinese households save over 38% of their incomes (the comparable rate for the United States is just 6%).
With consumption’s share of GDP rising slowly, Chinese authorities have continued to direct investment to heavier industries in an effort to sustain employment and economic growth. This has contributed to a significant accumulation of debt, which has grown at twice the rate of nominal GDP for a very long time. However, the gap between credit and nominal GDP growth has closed recently. 
Loan delinquencies have been rising in China (albeit from low levels) and authorities have been concerned about the leverage behind “wealth management products” (WMPs). WMPs are high-yielding investment vehicles that accumulate equities, real estate and other assets and sell shares to the investing public. They aren’t the most transparent of instruments, though. And while they are offered by China’s banks, they are not guaranteed by China’s banks. 
 
They have nonetheless been very popular because local investors are severely limited in their ability to purchase assets outside of China. But several WMPs have failed over the last few years, illustrating their vulnerability. Chinese authorities have generally made owners of WMPs whole, to avoid financial panic. Retail investors who learn their money isn’t entirely safe can react en masse, an outcome that can shake a financial system to its foundations. 
Attempts by the regulators and the People’s Bank to curb WMPs have to be carefully calibrated. Past attempts have provoked untidy market reactions and threatened confidence. A renewed effort in this direction was initiated late last year; borrowing rates have risen significantly since then.
Chinese provinces are also adding to the country’s debt accumulation. Regional governments, seeking to meet growth targets, have been expanding their issuance of bonds to finance local projects. Analysts think this practice has contributed to excesses in real estate and industrial capacity. This may be among the situations Chinese President Xi Jinping may seek to address after consolidating his power at this year’s party congress. 
China has not committed what the International Monetary Fund (IMF) calls “original sin,” borrowing internationally in currencies other than their own. In theory, then, the central bank could simply run its printing press to cover losses and preserve the banking system. But such an action could generate inflation, deflate asset prices, diminish real incomes and hinder economic growth. 
China has expressed a vision for the next decade that aims to allow markets to operate more freely. But the fragile state of Chinese finance may cause this objective to be deferred. 
Irreconcilable Differences? 
When the Chinese decide to press ahead with a reform program in earnest, it may run into an economic concept known as the “trilemma.” Simply stated, a country cannot simultaneously be open to capital flows and expect to keep control of its currency and its central bank. During the past generation, China has carefully managed all three of these. 
Recently, China has allowed its currency to float a little more freely as a prerequisite for entry into the IMF’s Special Drawing Rights (SDR) facility. (Some would contend that the heavy hand of management reasserted itself after this designation was secured.) China has cautiously opened its capital markets to outside investors and allowed its residents to make limited investments outside the country. But each step will require ceding a little authority and accepting more potential volatility. 
It is exceptionally difficult to progress from close control to complete freedom. Given the connection in China between social stability and financial stability, one wonders if it will be able to complete this transition successfully. 
China’s ability to work through its economic evolution would be challenging under even the best of circumstances. But last November 8, circumstances changed. 
Candidate Donald Trump expressed no great affection for China’s economic practices, criticizing the country for manipulating its currency, stealing intellectual property and costing American jobs. President Trump began to follow through on these views by appointing two China hawks to key positions in the administration. 
Peter Navarro, author of the book “Death by China” (a video covering the material can be found here), is serving as Director of the White House National Trade Council. And Robert Lighthizer was recently confirmed as U.S. trade representative. Both men have vowed to address what they see as economic injustice perpetrated by China on the United States. 
China has certainly amassed a sizeable trade surplus with the U.S. And while manufacturing employment has been ebbing for decades in the United States (largely the result of technology), the pace of job losses did accelerate when China was granted permanent Most Favored Nation trading status in 2001. 
China’s defenders point out that U.S. exports to China have grown rapidly and stand to grow even more as consumerism takes deeper root there. Further, American consumers derive important benefits from the inflow of inexpensive goods from China. The balance sheet between the two countries has many entries on both sides of the ledger, and it is nearly impossible to determine who has net equity.
The 2016 U.S. election gave voice to the economically aggrieved. Identifying China as a villain played well to this audience, and the administration vowed to reward its support with action. The tone was set in early December by the president-elect’s call to the president of Taiwan. This enraged Beijing, for whom “one China” is more than a slogan. The U.S. proposals for a border tax, which would have disadvantaged U.S. importers, did not help. 
The April summit between Presidents Trump and Xi has seemingly calmed the waters, for now. Rhetoric has cooled, and the two recently announced an agreement that would open Chinese markets to American beef and financial services. (Hailed by U.S. Commerce Secretary Wilbur Ross as a “Herculean” achievement, the terms of the accord had largely been agreed to last year, when Barack Obama was still president. And the accord will barely move the needle on the bilateral trade balance. Nonetheless, it appeared to represent constructive détente.) 
An outright confrontation is in no one’s best interests. For the United States, getting tougher on trade could result in rising inflation without creating much incremental employment. China (among others) would certainly respond if the administration acted unilaterally; the U.S. sells to China a substantial amount of grain, which could easily be a target of retaliation. A faltering China would certainly challenge Western markets, as it has on several transitory occasions in the recent past. 
And then there are the military and strategic issues that surround the relationship, including the management of North Korea. 
It may well be that Washington’s harsh initial tone with Beijing was rhetorical, an effort to re-center discussions that will end with moderation. But should tensions escalate once again, the consequences on several levels would be severe. 
My wife and I have been together for more than 37 years. Like any long relationship, ours has had its twists and turns; but ultimately, an upward trajectory. I very much hope that China and the United States sustain the kind of long-term partnership that allows each to realize its full potential. 
Abrazos,
PD1: Nuevos caminos para el mundo global, para hacer más corto el viaje, para no tener que navegar desde tan lejos…
ALVARO ORTIZ VIDAL-ABARCA ES MIEMBRO DEL EQUIPO DE BBVA-RESEARCH
"Mientras que parte del mundo occidental se afana en encontrar estrategias defensivas para combatir el bajo crecimiento económico, China pasa al ataque y acelera su proyección económica y geopolítica exterior mediante la llamada ruta de la seda”. Lo que inicialmente se vio como un proyecto regional asiático y exótico ha terminado por encandilar, entre otros, a muchas potencias europeas. Al final, estar conectado de una manera u otra a la zona geográfica donde se va a generar cerca de tres cuartas partes del crecimiento mundial no es mal asunto.
La iniciativa consiste en un gigantesco proyecto de infraestructuras para actualizar la antigua conexión entre Oriente y Occidente. Se hará mejorando varias rutas terrestres y una marítima. Involucra a 63 países, desde China hasta Europa, y de acuerdo a algunas estimaciones como las de Bruegel requerirá, de momento, un montante cercano a los 500.000 millones de dólares (de los cuales sólo se han proyectado cerca de 900). Los intercambios de bienes, flujos financieros, personas, tecnologías, culturas e ideas se moverán a una escala mucho mayor.
Para China, el proyecto tiene múltiples ventajas. En primer lugar, mejora el transporte y las comunicaciones con nuevos socios comerciales, desde sus vecinos fronterizos, a los países de Asia Central, Rusia y Oriente Medio, llegando hasta Turquía y los países del Este de Europa. La ruta marítima mejora su potencial de intercambio comercial con Oriente Medio. El exceso de capacidad de algunas empresas estatales chinas, el avance en su estructura productiva (más acorde con a su grado de desarrollo) y la reducción de los costes de transporte apuntan a China entre los mayores beneficiados.
Las ventajas se extenderán al ámbito económico. Las ingentes necesidades de financiación no pueden ser del todo cubiertas por los países involucrados ni por el recién creado Banco Asiático de Inversión en Infraestructuras (BAII). Serán los bancos chinos, en proyectos de iniciativa público-privada, los que llenen este vacío reduciendo el exceso de ahorro local dedicado a préstamos domésticos. Geopolíticamente, China aumenta su capacidad de proyección tierra adentro, sin descuidar su presencia marítima, mientras que aumenta significativamente su proyección internacional no tangible o soft power.
Los europeos también nos beneficiaremos. Las ventajas comerciales derivadas de la reducción de costes de transporte serán importantes e inicialmente más elevadas, pues de momento no se ha hablado de acuerdos comerciales bilaterales, que favorecerían a los países asiáticos con aranceles más bajos. Las mejoras en los flujos de inversión pueden llegar a ser potencialmente elevadas a medida que las empresas europeas y españolas aceleren su participación en los proyectos de ingeniería civil y financieros. Por último, y no menos relevante, el proyecto puede reforzar importantes flujos tanto de personas, como de clases medias emergentes, empresas o ideas. Sin duda, todo un proyecto que esta vez viene de Oriente.
PD2: El pecado original ocurrió porque nos quisimos hacer como Dios, tener el poder de Dios, de decidir lo que está bien y lo que está mal. Esto se repite hoy todos los días. El demonio nos tienta y nos presenta una ruptura con Dios. El demonio nos va probando. El demonio conoce muy bien a Dios…, y sabe de nuestra debilidad.
Ser como dioses, es ser conocedores del bien y del mal, ser nosotros los que decidamos qué es el bien y qué es el mal.
Hoy, como hicieron nuestros primeros padres, seguimos comiendo del mismo árbol: esto está bien y esto está mal. Yo soy la medida de todas las cosas, el que decide. Esto produce el alejamiento actual de Dios: echamos a Dios de nuestro mundo, ya que queremos suplantarle.
Hay que intentar volver a ordenar el mundo y reconocer a Dios como creador: alabar a Dios, darle gracias, amarle…
No podemos quedarnos indiferentes ante el pecado, ante lo que hacemos mal, no debemos ser como dioses que deciden lo bueno y lo malo de lo que hacemos. El hombre se avergüenza y se esconde de Dios cuando peca, como Adán y Eva. El pecado desfigura al hombre. Fue por eso por lo que nos mandó a su Hijo, al Salvador, se produjo una recreación, una nueva creación, nos hizo hijos suyos y nosotros le reconocemos como Padre (por el Bautismo dejamos de ser creados por Dios, para ser Hijos de Dios).

24 mayo 2017

qué va a pasar ahora

Es un problema de valoraciones. Que las bolsas occidentales sean capaces de seguir subiendo, es un tema de los altos precios alcanzados…

What’s Going On?

Why does it feel like every time stocks falls a little, they’re going to fall a lot? This is probably a permanent feature of the stock market, but it seems like that drum is beating very loud these days. I believe there are two main reasons why some investors have three feet out the door.
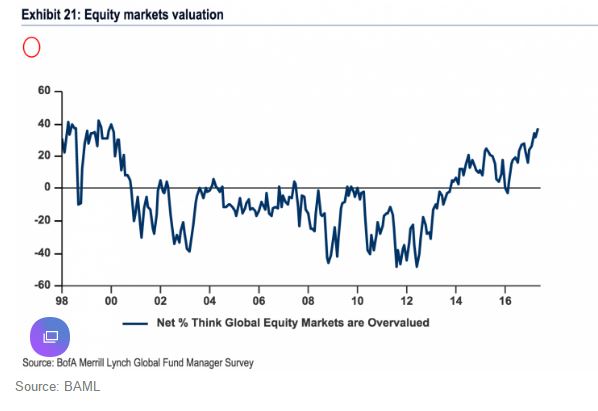
First, everybody knows stocks are overvalued. Or, said more accurately, everybody knows that stocks are trading at a higher multiple than they have historically. It’s hard to go a day without seeing an article referencing the CAPE ratio. The chart below from Bank of America Merill Lynch shows that 37% of fund managers they surveyed think stocks are overvalued, the highest reading since January 2000.
So stocks are expensive and people are waiting, nay, begging for them to come down. This, coupled with the fact they haven’t pulled back in so long has created a weird feedback loop where the lack of movement is making some investors paranoid. It “feels” like there is a rug-pull moment coming any day now.
A few interesting statistics on how calm the market has been; There has been just one -1% day in the S&P 500 in 2017 (Today could be the second). Up until this point in 2016, the S&P 500 fell 1% 17 times.
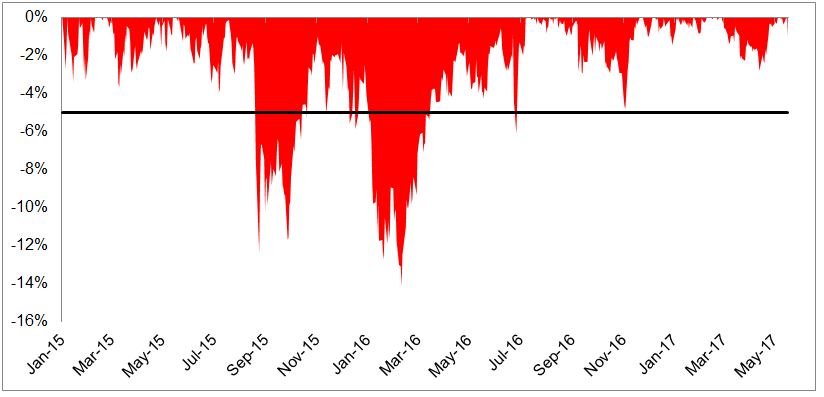
I was surprised to find that the S&P 500 hasn’t had a 5% pullback since July 2016.
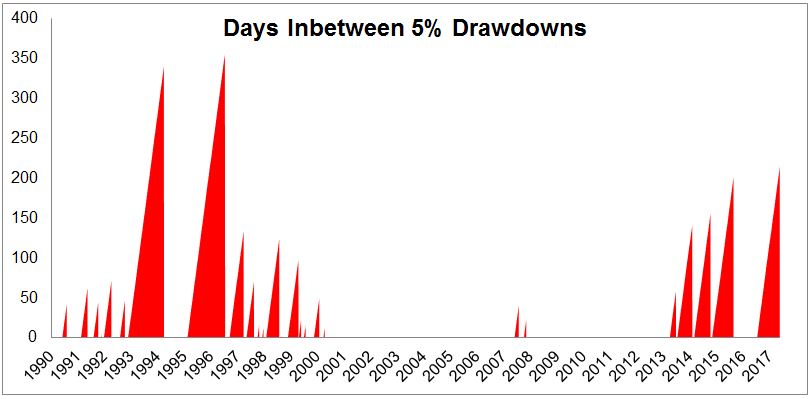
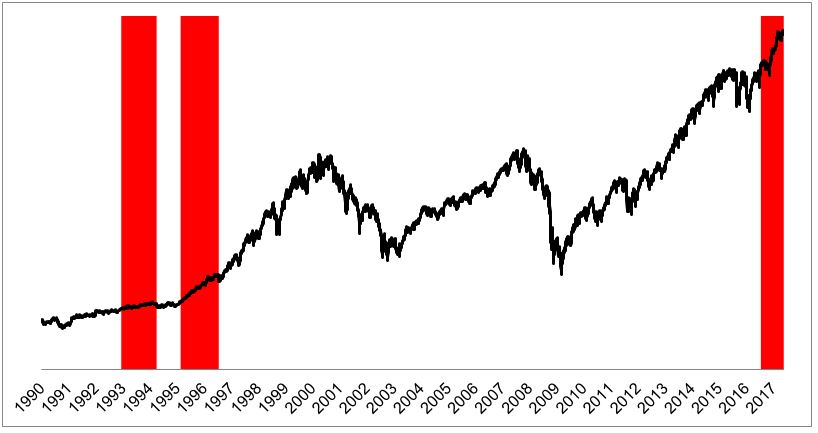
The chart below shows that the index gone 215 days without a 5% drawdown, which is the longest streak since 1996!
The chart below shows the two previous streaks that lasted at least as long as the current one. There was no rug pull in 1994 or 1996, both ended with drawdowns less than -10%. Obviously this provides us with us no information as to how this will play out, such is the nature of historical data.
Stocks are expensive yet they have refused to go down, and the noise coming out of Washington probably isn’t helping investor psychology. It’s difficult to stay invested these days, but isn’t it always.
Abrazos,
PD1: Siempre es igual en todas partes: se suele invertir más en donde se vive, ya que se cree que se controla más, o mejor dicho, se cree que se conoce mucho mejor… Y se pierden grandes oportunidades invirtiendo fuera. Conozco tal barbaridad de gente con carteras enormes en los bancos españoles que, sí fueron muy rentables en los años 90, pero desde el 2000 no se comen ni un colín…
by Rick Friedman of GMO,
It is a well-known fact that investors skew their equity exposures toward their home country – that is, they exhibit a home country bias. According to data from the IMF’s Coordinated Portfolio Investment Survey,1 US investors allocated over 70% of their equity assets to the US even though based on market capitalization the US represents less than 50% of the opportunity set. This by no means is a US-only phenomenon. Canadian and Australian investors exhibit similar levels of concentration of equity exposures (60%-70%) in their domestic markets despite these markets representing only 3.3% and 2.4% of the global opportunity set based on their respective weights in the MSCI ACWI index. The recent strong returns of US vs. non-US stocks is most certainly at the top of the list in explaining the strong preference many currently harbor for US equities.
US and non-US stocks have traded leadership over many cycles and decades. The yellow portions of the graphs in Exhibit 1 indicate periods in which US stocks have outperformed their overseas developed brethren. In particular, as the far right side of the first graph suggests, both the magnitude and duration of the US outperformance over the last nine and a half years have reached extreme levels. The US and emerging equity markets have displayed similar leadership cycles, though over shorter periods of time and with even more dramatic relative performance cycles.
Certainly, a portion of the US outperformance is warranted. US equities did not need the recent election to make them “great.” While the economic recovery from the 2009 recession has been muted, US companies have delivered stronger and more consistent fundamental growth relative to developed and emerging companies, especially during the last few years. Policymakers in the US took aggressive steps during the GFC, helping the US economy and market to recover more quickly. One such step was to require banks to recapitalize their balance sheets (often through painful dilution and write-downs). The same could not be said outside the US. The Eurozone remains exposed to sovereign credit issues and more levered banks. In Japan, aggressive fiscal and monetary actions came eventually but failed to stimulate the slow-growing nation, which continues to face persistent demographic and other structural challenges. Emerging countries (and their currencies) initially benefited as China responded to the GFC aggressively through debt-supported infrastructure spending, but over the last few years emerging countries have seen their expensive currencies reprice and have had to adjust for slower growth in China and its subsequent adverse impact on commodities prices.
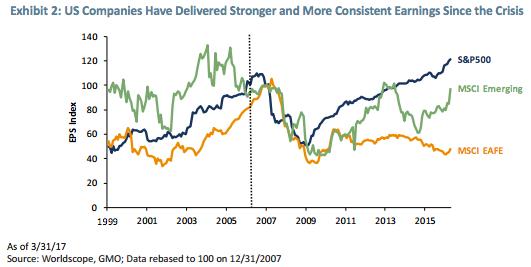
Exhibit 2 indicates the strength and steadiness of the earnings recovery in the US vs. EAFE and emerging markets. US earnings stand 21% higher than at the beginning of 2008, while EAFE earnings have been cut in half and emerging earnings are flirting with being flat.
In response, investors drove equity prices significantly higher in the US than outside the US. From the end of February 2009 through March of this year, the S&P 500 has returned an impressive 18.0% per year, while the MSCI EAFE and MSCI Emerging Market indexes have delivered 10.8% and 11.2% per annum, respectively. On a cumulative basis over this 8-year period, US stocks rose about 170% more than nonUS equities. That is 1.7x more wealth to sit comfortably within the confines of the United States! It is no wonder that many investors have been reluctant to shift equity exposures away from the US. We would argue this is a classic case of recency bias: Investors are extrapolating the excellent returns US stocks have provided of late far into the future. While most assets appear expensive after many years of strong gains, US equity valuations currently stand far higher than non-US valuations.
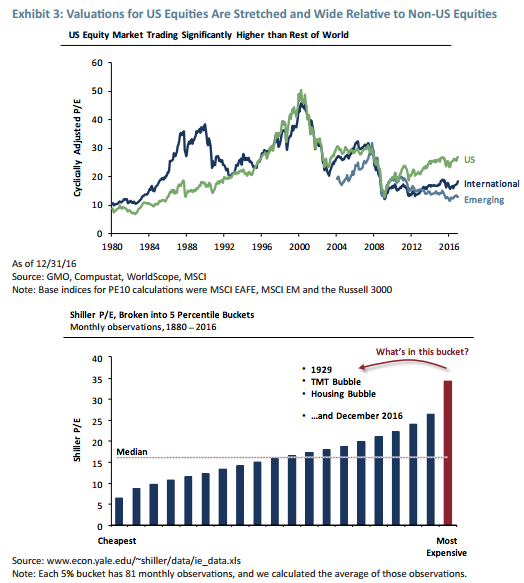
Using Shiller’s cyclically adjusted P/E (CAPE) ratio, one of many valuation measures, Exhibit 3 illustrates both the expensiveness of US stocks and the relative attractiveness of developed and emerging equities. A yawning gap has opened up in the relative multiples for these various geographic exposures. Today’s CAPE of 29x for US equities does not look too stretched in this exhibit. The second chart below, however, puts the expensiveness of the US markets into broader perspective. The market is trading in the most expensive ventile in history! The only other times US equities have been this expensive on this measure include 1929, the peak of the Internet bubble, and in 2008, just before the GFC. For those inclined to dismiss CAPE, other valuation metrics such as the Price/Sales ratio have soared to dizzying heights as well.
Investors have clearly rewarded US companies for their higher earnings growth by paying significantly higher prices for them. Perhaps, though, the market has gotten ahead of itself. Equities are long-duration assets – investors are not just buying stocks for the next few years of earnings, they are buying an earnings stream stretching out for decades. In competitive economies and markets, both valuations (price multiples) and profit margins (return on capital) tend to mean revert. Our founder and Chief Strategist Jeremy Grantham, however, points out a number of reasons why US profit margins may stay elevated and take longer than prior periods to mean revert (see “This Time Seems Very, Very Different,” Jeremy Grantham, 1Q 2017). While valuation has been a great predictor of return, it unfortunately does not tell us much about the timing in which assets will mean revert to fair or normal levels. We still believe, though, that the price you pay for an asset is the biggest determinant of the return you will make. The more you pay, the less you will make.
Rather than buy the comfortable asset, investors should ask, “What’s in the price?” We would argue that the relatively good news in the US is more than reflected in asset prices. Emerging and developed ex-US stocks look to be more attractively priced (even accounting for higher fundamental risks). In fairness, nothing looks cheap. The best we can say is that value stocks in emerging markets look to be near fair value and that the spread between expected returns for emerging market value and US stocks is quite wide. In addition, emerging markets offer modestly attractive currencies. We believe long-term investors able to ride out the invariable market swings should fight their home country bias and buy emerging.
1 International Monetary Fund, “Coordinated Portfolio Investment Survey,” June 2016.
PD2: San Agustín decía que había que pedir siempre con perseverancia. Pedimos mal y se nos concede lo que necesitamos. Yo creo que a Dios le gusta que le pidamos cosas espirituales, no materiales.
El ideal es convertir el día entero a Dios: es lo que se llama la oración continua. Ofrecer todo lo que hacemos a Dios, todo lo ordinario, el trabajo profesional y el de casa, los afectos, la caridad con los demás, el apostolado. Si así lo hacemos, si ofrecemos todos nuestros quehaceres, estaremos rezando todo el día, pidiendo, dando gracias, alabándole…

23 mayo 2017

lo miremos como lo miremos

Las bolsas occidentales están caras. Y no quiere por eso decir que vayan a bajar…
Los impulsos correctivos se enjugan con tal rapidez, que todo tiene pinta de que subir es el único camino posible. Antes las correcciones duraban semanas. Ahora duran horas. Mira el indicador de riesgo (volatilidad), se disparó la semana pasada y ha vuelto a los mínimos históricos de hace muchos años. No hay miedo a correcciones:
Pero no cabe duda de lo caras que están las bolsas occidentales. Nuevos tiempos y nuevas formas de comportarse de los inversores…
After last week's brief FBI "memogate" inspired volatility spike, some have asked if the resulting market decline (down a "whopping" -0.4% on the week) has made stocks more attractive.|
 Here is the quick answer according to Bank of America: based on the 20 most widely used valuation metrics, the S&P remains significantly overvalued on 18 of 20 valuation metrics, the only exceptions being free cash flow, helped by depressed capex), and relative to bonds, whole yields are depressed thanks to $18 trillion in global central bank purchases.
And a bonus chart: why is the market so overvalued? Because 2017 has continued the trend seen in 2016, when the market "shrugged off one event after another."
One wonders what happens when all the "event gaps" start getting filled...
Abrazos,
PD1: No se justifican ni por los tipos de interés tan bajos…, que todos sabemos de su temporalidad por ser artificiosos.
Just recently my colleague Jesse Felder penned an excellent piece discussing the use of the“four most dangerous words” in investing: “this time is different.” The whole article is a must read, but he hit on a particular point that has become a mantra for speculative investors as of late:
“In other words, valuations don’t matter as much as they did in the past because ‘this time is different’ in that interest rates are so low.”
The basic premise of the interest rate/valuation argument has its roots in the “Fed Model” as promoted by Alan Greenspan during his tenure as Federal Reserve Chairman.
The Fed Model basically states that when the earnings yield on stocks (earnings divided by price) is higher than the Treasury yield; you should be invested in stocks and vice-versa. In other words, disregard valuations and buy yield.
Let me warn you now this will not end well.
There is an important disconnect that needs to be understood.
You receive the income from owning a Treasury bond, however, there is NO tangible return from the earnings yield. 
For example, if I own a Treasury bond with a 5% coupon and a stock with a 8% earnings yield, if the price of both assets don’t move for one year – my net return on the bond is 5% while the net return on the stock is 0%.
Which one had the better return?
Yet, analysts keep trotting out this broken model to entice investors to chase an asset class with substantially higher volatility risk and lower returns.
It hasn’t been just since the turn of the century either. An analysis of previous history alone proves this is a very flawed concept and one that should be sent out to pasture sooner rather than later. During the 50’s and 60’s the model actually worked pretty well as economic growth was strengthening.
Then, beginning in 1980, as Reagan and Volker set out to break the back of high-interest rates, the model no longer functioned. During the biggest bull market in the history of the markets, you would have sat idly by in Treasuries and watched stocks skyrocket higher.  
However, not to despair, the Fed Model did turn in 2003 and signaled a move from bonds back into stocks. Unfortunately, the model also got you out just after you lost all of your gains during the crash of the markets in 2008.
Currently, the model once again seems to be working. However, is the recent decline in interest rates, driven by massive global Central Bank interventions, should be sending a warning signal to investors. The chart below takes the interest rate argument from a little different angle. I have capped interest rates from their “low point” of each interest rate cycle to the next “high point” and then compared it to the S&P 500 index. (The vertical dashed lines mark the peaks in the S&P 500 Index)
In the majority of cases, the market tends to peak between the low point interest rates for each cycle and the next high point. In other words, a period of steadily rising interest rates is not conducive to higher equity prices. 
Cliff Assness, in his 2003 paper on the Fed Model, debunked the three primary arguments for the model as follows:
“Refuting Argument #1-The Competing Assets Argument: Argument #1 is that stocks and bonds are competing assets, and thus we should compare their yields. Now we see that the yield on the stock market (E/P) is not its expected return. The nominal expected return on stocks should, all else equal, move one-to-one with bond yields (and entail a risk premium that itself can change over time). But this is accomplished by a change in expected nominal earnings growth, not by changes in E/P.
Refuting Argument #2-The PV Argument. Argu­ment #2 is that when inflation or interest rates fall, the present value of future cash flows from equities rises, and so should their price (their P /E). It is absolutely true that, all else equal, a falling discount rate raises the current price. All is not equal, though. If when inflation declines, future nominal cash flow from equities also falls, this can offset the effect of lower discount rates. Lower discount rates are applied to lower expected cash flows.
The typical ‘common sense’ behind the Fed model ignores this powerful counter-effect, in effect trying to use lower nominal discount rates, but not acknowledging lower nominal growth. You would be hard pressed to find a clearer example of wanting to both have and eat your cake.
It is indeed possible to think of stocks in bond terms as the Fed model attempts. Instead of regarding stocks as a fixed-rate bond with known nominal coupons, one must think of stocks as a floating-rate bond whose coupons will float with nominal earnings growth. In this analogy, the stock market’s P/E is like the price of a floating-rate bond. In most cases, despite moves in interest rates, the price of a floating-rate bond changes little, and likewise the rational P/E for the stock market moves little.
Refuting Argument #3-Just Look at the Data: Historically, when interest rates or infla­tion are low, the stock market’s E/P is also low, and vice versa. This, Fed modelers say, shows that the market does in fact set the equity market’s P/E as a function of the bond yield, implying the Fed model is a good tool for making investment choices.
Pundits using this.argument assume that because they show that P/Es are usually high (low) when inflation or interest rates are low (high), the Fed model is necessarily a reasonable tool for making investment decisions. This is not the case. If investors mistakenly set the market’s P/E as a function of inflation or nominal interest rates, then the chart above is just documenting this error, not justifying it.
A simple analogy might be helpful. Say you can successfully show that teenagers usually drive recklessly after they have been drinking. This is potentially useful to know. But, it does not mean that when you observe them drinking, you should then blithely recommend reckless driving to them, simply because that is what usually occurs next. Similarly, the fact that investors drunk on low-interest rates usually pay a recklessly high P/E for the stock market (the Fed model as descriptive tool) does not make such a purchase a good idea, or imply that pundits should recommend this typical behavior (the Fed model as fore­casting/ allocation tool).
The pundits often confuse these two very different tasks put to the Fed model. They often demonstrate (each with a particular favored graph or table) that P/Es and interest rates move together contemporaneously. They then jump to the conclusion that they have proven that these measures should move together, and investors are thus safe buying stocks at a very high market P/E when nom­inal interest rates are low.
They are mistaken. The Fed model, in its descriptive form, documents a consistent investor error (or a strange pattern in investors’ taste for risk); it does not justify or recommend that error.
So, when pundits say it is a good time for long-term investors to buy stocks because interest rates are low, and then show you something like chart above to prove their point, please watch the tense of what they say, as what they often really mean is that it WAS a good time to buy stocks ten years ago, as investors are now paying a very high P/E for the stock market (perhaps fooled into doing so by low interest rates as I contend), and the story going forward may be painfully different.”
The last point is crucially important. As shown in the chart below, which compares earnings yield to forward 10-year real returns, when E/Y has been near current levels the return over the next 10-years has been quite dismal, to say the least.  (Read more on the Cyclically Adjusted Earnings Yield)
Importantly, it is imperative to remember that earnings yields, P/E ratios, and other valuation measures are important things to consider when making any investment as they are very predictive of long-term returns from the investment. However, they are horrible timing indicators.
As a long term, fundamental value investor, these are the things I look for when trying to determine “WHAT” to buy. However, understanding market cycles, risk/reward measurements, and investor psychology is crucial in determining “WHEN” to make an investment. 
In other words, I can buy fundamentally cheap stocks all day long but if I am buying at the top of a market cycle I will still lose money.
As with anything in life – half of the key to long term success is timing.
While there is much to debate about the current level of interest rates and future stock market returns, it is clear is the 30-year decline in rates did not mitigate two extremely nasty bear markets since 1998, just as falling rates did not mitigate the crash in 1929 and the subsequent depression.
Do low-interest rates justify high valuations?
History suggests not. It is likely a trap which will once again leave investors with the four “B’s” following the next recession – Beaten, Battered, Bruised and Broke.
“Never forget, things change” – Lowell Miller
PD2: Víctor Küppers: El efecto bombilla: La importancia de la actitud. ¿Cuánto vales como persona? Descubre los elementos que componen esta fórmula y cómo la psicología positiva puede influir tan notablemente en nuestras vidas y en la de las personas que nos rodean: