Vamos hacia un mundo distinto, completamente diferente al que hemos vivido. Nos lo vamos a encontrar de bruces, o estaremos atentos a no cometer muchos errores. En eso es en lo que te intento ayudar…
A Brave New World is coming? Perhaps. We had a recent discussion with a group of people in the hopeless business of doing long term forecasting. This made us think about what the world will look like over the next 20 to 40 years. A pretty thankless task, but the bottom line is without a damn good war, Asia will be the way of the future.
As an experiment, assume, as most long term forecasters do, that both Europe and the US have reached a mature plateau where growth will average around 1.5 to 2 per cent over the long term, while China will slowly decelerate from the current 6.5 to 3 per cent and India from today`s 7 to around 4. In this scenario (which we do not necessarily believe in, as China is up for en epic crash) what will be the share of global GDP by, say, 2060? And what are the geopolitical implications?
Using data from Angus Maddison, the IMF and then extrapolating with our simple assumptions (which are just as good as any) we get the following picture.
In international dollar terms (PPP) China is already the world largest economy. By 2060, under the abovementioned assumptions, China will constitute almost 30 per cent of global GDP, almost reaching the level Western Europe had when establishing the European dominance over the world. The US and Europe will both be less than 10 per cent of the world economy. It is also interesting to note that India will surpass Western Europe already in 2030 and be close to 20 per cent by 2060. The two Asian behemoths will together constitute 45 per cent versus the US and Western Europe’s mere 17 per cent in 2060.
What happened the last time such seismic shifts in economic gravity took place? The first industrial revolution was all about Western Europe, with England and the Low Countries the predominant actors. The foundation for the British Empire was laid and the unipolar world that followed was relatively stable with Britain as the undisputed hegemon.
However, the second industrial revolution quickly spread to Germany and the US. Not long after, the British economy lost is preeminent place a manufacturer of the world. Britain understood that the unipolar world its empire represented would be lost unless the newfound players could be contained. Germany in particular was keen on an empire and started its exploits in Africa in the 1880s to the detriment of an expanding British empire. The straw that probably broke British patience was the German-funded railway to the Middle East. When completed the Brits, as the unquestionable global naval power, would lose control over German oil supplies. The Germans would also gain access to the port of Basra, avoiding the Suez Canal for access to the eastern part of the German colonial empire. German demand for more “Lebensraum” obviously did not go down well with Westerminister. The tragic end result was the industrial killing of Europeans on a scale never witnessed before.
By taking on Germany, Britain tried to bite off more than it could chew. Britain ended up bankrupt and the US emerged as the largest creditor nation on the planet. While it took some time to make the transition, by the end of World War II the US was the undisputable super power. However, this was merely a change of headquarter as the Imperial City of the British empire moved from London to New York. Culturally the two nations were and still are close; and to this day the special relationship between Britain and the US is cultivated more than any.
Still, the key takeaway from the period stretching between 1880s to 1914 (or 1945) is one where the world hegemon experience relative decline as its manufacturing base is outcompeted by technologically advancing competitors amid a deteriorating balance of payment. The end result was a world in turmoil with legacy structures, be it political and economic, changing beyond recognition.
While history never repeats itself, it certainly rhymes and today’s situation is in many respects quite similar to the pre-WWI period. Once again, we have a global hegemon going deeper and deeper into debt. A balance of payment problem, funded by the “exorbitant privilege” of issuing the global reserve currency, has transformed the US from the world’s largest creditor nations to the largest debtor.
Emerging economies thus feel confident when threatening the US dominance by increasingly making their presence felt in what used to be US (or US satellite states) exclusive territory. China in particular claim surrounding waters as its playground and a more assertive Russia has started to fight back against NATO mission creep.
Just as in the pre-WWI era, military spending by potential adversaries is catching up with the hegemon. Proxy wars are increasingly being fought as the world move toward a multipolar world order. As history has shown, the transition from a unipolar to a multipolar world can be taxing and unfortunately bloody. It is also worth noting that the Beijing consensus is materially different from the London/Washington worldview. While moving the Imperial City from London to Washington was not all bad for Europe, another move to Beijing could be far more disruptive.
Bottom line, if you believe in the growth assumptions outlined above, the world economy and by extension, political constellations are due for changes unprecedented in later modern history. Finally, it will be more than interesting to see either a Clinton or Trump presidency tread what will undoubtedly be very treacherous waters.
One of the most widespread misconceptions in the realm of politics is the notion of a left-right axis. This has been used over and over to explain political outcomes and paint the various factions as polar opposites. For example, in the US the two main parties, the Republicans (right) and Democrats (left), are often portrayed as a fight between good and evil. Which party representing good and which one is advocates of evil is highly subjective and obviously, “our” team is always considered good, while “they” are evil. Then there are factions to the right and left of mainstream parties which are then considered extreme versions of left and right. To the right of right-of-center you find somewhat confusing a hodgepodge of various totally unrelated groupings such free-market libertarians, racists and fascists. On the left of left-of-center we find the usual socialists and communists.
This makes very little sense and as we have shown on these pages earlier, the chart below gives a much better description of the political reality. Libertarians are the polar opposite of fascists, but the left-right axis bundle them together on the far right side. By doing so libertarians are easy to dismiss as simple-minded racists. This blurs political concepts and directly baffles pundits and commentators alike when results such as Brexit and Trump “surprisingly” go against conventional wisdom. How can the “extreme” rightwing Trump win Democratic stronghold states such as Pennsylvania, Michigan and Wisconsin? They should, in theory, be diametrical opposite. One simple example should suffice to prove our point; an elderly gentleman with more than thirty years’ experience as a geopolitical advisor claimed that Ludwig von Mises, a Jewish libertarian living in Austria in the 1930s, was clearly a staunch fascist. Even the professionals or maybe them more than any, are fooled by this false dichotomy which help explain why people today are shocked by what is going on in the Western World.

We see things very different; to the northeast in our chart, we find political parties favoring more government intrusion to both economic and social life, while the southwest represents individual freedom. To make the chart complete there should be a third axis denoting international socialism/fascism and national socialism/fascism. The current power elite support the welfare state, heavy regulation of economic activity and social control over the masses. It is true that some want more economic regulation (Democrats) and some want more social control (Republicans; gay marriage, abortion. Democrats; political correctness = stifling free speech, especially aimed at the attitudes in “Flyover America”), but there are consensus on the need to control and intervene heavily. The current political elite also supports internationalism under the auspice of “globalism” where migration, trade and capital are relatively free to move as it sees fit. This has obviously led to higher wage gains for the world’s lower middle class and lower wage gains for the higher middle class as the world labor market have become more unified. In addition, asset holders throughout the world has also benefited, especially from a global monetary policy that has provided the impetus for a decoupling between underlying fundamentals and the price of securities that are supposed to represent an economy’s productive potential.

Listening to what Trump, Farage, Le Pen, Wilders and Grillo actually says one will soon realize that these are not libertarians. On the contrary, according to www.greatagain.gov the new Trump administration will expand fiscal policy by increasing infrastructure, military and other spending to the tune of USD2 – 3 trillion more than what is baked into the already unsustainable debt equation. So we wonder what Mr. Krugman is so upset about? This is exactly the fiscal stimulus left leaning economist have wanted for years. Movements in bonds markets since Trump was elected suggest Mr. Market believe it will come. Right wing Le Pen, Wilders and supposedly their opposite left wing Grillo are aiming for the same. Not one of these so-called populists talks about dismantling the European welfare state and reinstating 19-century pure capitalistic market pricing and resource allocation.
However, there are one main difference between the new movement spreading across the US and Europe in comparison to the struggling status quo. While still socialists, the new movement understand why the once affluent middle class of the western world are upset. They cannot make ends meet as they find themselves in a situation whereby the central bank target a domestic price level in a world where prices are set on global markets. To achieve a two per cent CPI target when import prices are falling due to the “China-factor”, it is given that non-tradable prices must grow far faster than two per cent. From this we can conclude that essentials, such as housing/rent, education, food and medical expenses will grow far faster than then aggregate CPI if the two per cent target is to be reached. Data from the Bureau of Labor Statistics substantiates this view.
While it is certainly nice to buy a new flat-screen TV imported from Asia on the cheap, it is not helping if housing, food and medical expenses already lay claim to all of household income. If these people dare vent their frustration, the urban elites call them racist bigots and effectively shut them down. Until 2008 Flyover America could effectively be silenced by giving them access to cheap and plentiful amounts of debt, which helped paper over the lack of real household income growth. When the credit channel broke down at peak debt, the harsh reality made itself felt.
Within this economic, financial and political climate the international socialist are bound to lose. In enter the national socialists. They promise to return to the good old days when a union worker at the GM factory made USD100k plus full benefits. They tell people the welfare state will be there for them. They will force companies to bring off-shored jobs back home. They will stop immigration. Bottom line, they promise to re-create socialism without globalism. Socialism for the nation state.
The key point is that the political distance between a vote for the international socialist and the national socialist voter is miniscule. A blue-collar worker in Pennsylvania, downtrodden by years of hardship, will easily switch to the party that promises to restore old glory days. Pundits are obviously puzzled – how can a union man vote for the party for the rich? How can he vote for a party that are miles away from his political self-interest? The answer of course is that the union man is not. He is rationally voting for a party closely resembling the one he used to vote for, only this one comes with a slightly new rhetoric.
Which is exactly why we will see more shocks to the system as national elections will yield results that upset the status quo in the Netherlands, France, Germany and potentially Italy and the UK by the end of 2017. Be prepared for a new world order.
With that in mind, we close with a chart that perfectly sums up the world we see before us. Not only are we at peak debt with subsequent peak asset prices, we are at the precipice of Peak globalization itself.

A new world order is coming of age and the transition is painful to accept for a Western middle class with a deep-seated sense of entitlement. We showed how the West feels threatened globally in Toward a New World Order and followed up explaining how this translate into domestic politics in Toward a New World Order Part II. We will now continue this series by showing how gross economic mismanagement have created the new political class that we described in part two. As we stated back then, a large and increasing part of the electorate, swayed by neither the political correct socialist/feminist/cultural relativist dogma presented by the left, nor the lip service paid to free markets by a corrupted right, have taken hold in western democracies. They form a directionless blob of potential voters which until recently have drifted aimlessly along the political spectrum. Now they have made up their mind and it is proving pundits clueless as to what is going on. The “worker” making millions on Wall Street or by helping Google refine their search engine is not the same “worker” we find in flyover America. The young billionaire making apps to entertain confused millennials and snowflakes is not the same capitalist as the shale oil investor we might encounter in North Dakota. Political classes traditionally defined are useless as a tool to understand the world today. What is important to note though is that a growing minority of people with little to lose from the status quo is about to, or in many places have already become a small majority.
When people have nothing to lose and foresee a future of continued hardship they become desperate and are willing to change for the sake of change itself. When the current leadership provide nothing but more of the same hopelessness, they will move politically toward to candidates with views counter to that held by the establishment.
Before we move on, let us examine the upcoming election in France to show what we mean. In the traditional way of viewing national politics in France, it will be impossible for Le Pen and her Front National to win. Why? Because the left will hold their nose and vote for right-wing Republican Fillon in the second round to strategically avoid Le Pen. While some undoubtedly will follow the traditional recipe of left-right politics, it is far from certain that enough will do so to avoid a Le Pen victory. On the contrary, as we showed in part II, this line of thinking is outdated and a better representation is shown in the chart below.

Using our methodology, we come up with a far more likely scenario on how the French voters will vote come May. With the center right representing everything the middle class loath, they will not migrate from the center-left to help Fillon to victory. Le Pen’s vote base is not disillusioned UMP voters, but blue-collar workers that used to support the socialists and militant French unions. We do not draw this conclusion from some unique insight into French politics, but from observing a tendency across the whole of western society as a larger and larger share of the population have lost hope for the future. One of the most primal driving forces in humans is the belief in a brighter future. Dirt poor in Africa or pampered by the European welfare state, it does not matter. What matters for the positive development of the human spirit is an expectation that next year will be better than the current one. If that belief is taken from them, they will most certainly force real change on the system as they feel there is little to lose.

So what went wrong? There are many answers to this question and we have tried to address several on them on these pages earlier, such as excessive debt levels, monetary policy gone awry and demographics. We would also add to the list that we have seen a general tendency toward destructive policies as a result from people losing purpose in life; in this regard, it is no coincidence that environmentalism appeared as a new form of religion on the “godless” continent.
In That 70s Show (part I, II, III and IV) we spelled out how things changed after Nixon took the US dollar off gold and gave the Americans the ability to exchange nothing for something. Obviously, this created an irresistible incentive to consume more than the Americans could produce, which in turn artificially changed relative prices. A new productive structure emerged because of the new set of prices, but unless the dollar issuance continued, and even accelerateed, it would not be possible to sustain the ensuing capital allocation.
In other words, this road have taken us all down a very unpleasant path as every time the central bank, and/or the commercial banking system (including global dollar claims dubbed Eurodollars) is forced to retrench a recession must necessarily set in as the nothing-for-something-transaction have to be undone. However, as long as the global community accept dollar claims as money good the banking system can always gear up in time of crisis to avert the worst of inbuilt consequences stemming from past folly.
What made 2008/09 so special is the fact that the global dollar community had in fact reached peak debt. In other words, further dollar claims were no longer considered money good and the global banking system could no longer reflate the balance sheet, as this would have been unacceptable to their counterparties. A different way of looking at this is through the capital structure. At peak debt the current structure can no longer be funded as the pool of real savings is gradually depleted by the incessant something-for-nothing-transactions. We, as participants in a global economy, have essentially been consuming our seed corn.
In the 1970s the US economy employed about 50 per cent of its workforce in private sector service occupations. However, as the nothing-for-something system got under way the share of service sector employment rose almost constantly to reach more than 70 per cent today. This transformation can be characterized as a move away from tradable sector toward non-tradable, and was inevitable since the US manufacturing sector essentially had to compete against foreign products that cost the American system nothing to procure.
Service sector jobs have, or at least used to have, less scope for productivity improvements and hence real wage increases. Furthermore, goods producing sectors were clearly affected as they could no longer compete successfully against foreign producers. As a consequence, investments fell, thus dragging down productivity even more. Wages in tradable sectors naturally stagnated as a result. Amazingly, the real wage level in the 1970s for middle class workers is the same as today (using the BLS headline CPI index as deflator). Service sector wages must follow that of the goods producing sector and stagnated too.

Why did this not create a political movement toward National Socialism decades ago? Simply because artificial dollar claims were still considered money good worldwide. An increasingly creative financial system, in no doubt cheered on by corrupt politicians, thus took the best and brightest and told them to create ever more dollar liabilities to satisfy world demand. The masses could thus leverage their balance sheet with ease as banks needed collateral to sell abroad. Until 2008 that is. From that point on it all came crashing down as dollar claims were suddenly deemed unsafe. Banks could no longer expand their balance sheet at will and therefore the households and business couldn’t either.
The real pain from a four-decade long boom was suddenly felt as the system moved away from its exponentially rising growth trend toward one allowed by a broken Eurodollar system. (Some of the charts below came to be with great inspiration by the excellent work of Alhambra Investment Partner economists Jeffery Snider).
We could go on, but you get the picture. The recession of 2008 triggered a structural change in the global economy, and we are confident that the mechanism behind it is the breakdown of the Eurodollar system that came about at peak debt.
Before we end, we would like to highlight one more thing. As the American worker had to compete with zero cost foreign competitors, manufacturing businesses in the US were forced to either move abroad, shut down or invest in automation. This pressured workers even more and help explain why industrial output continued to rise even though the number of employees in the sector fell in successive waves. It is also noteworthy that this positive trend ended with the collapse of the Eurodollar.
Bottom line, the new world order that made itself felt in 2016 will be even more pronounced in 2017 with elections in the Netherlands (Geert Wilders could end up kingmaker or even prime minister), France (we predict a Le Pen victory) and Germany (where AfD will surprise everyone).
In the chart below, which we recreated from an absolute brilliant presentation by Macro Intelligence 2 Partners via RealVision-TV, we see the potential scale of the coming “dollar-problem”. The dollar moves in cycles as most things. The lower extreme around 84, only broken when Bernanke pushed through QE2, means financial conditions for emerging markets and other commodity producing economies have gotten so out of hand that conventional risk-metrics finally lead investors to pull back. The trigger, as can be seen in the chart, is often policy driven, but the underlying structural imbalance has been building for years, if not decades, prior.
Before we move on it is of utmost importance to understand that many of the dollar liabilities accumulated outside the United States are not backed by actual dollars, but are rather claims to dollar proper. This is the infamous Eurodollar market whereby banks, mostly international European ones, fund various economic activities by issuing claims to dollars, but for which no such dollars exists. Think of it as another layer of fractional reserve lending on top of fractionally created money in the first place.
When risk metrics stray too far from what is considered prudent, investors start to pull money out from emerging markets, and obviously demand that their investments are paid out in dollars. To comply, international banks scramble to get hold of as many dollars as they can in the shortest time possible in order to fulfil their part of the bargain. The value of the dollar jumps as demand suddenly outstrips supply. Financial conditions in emerging markets tighten significantly and it becomes impossible to fund further expansion. Emerging market banks, with dollar liabilities and LCU assets are particularly vulnerable. The boom turns to bust as the Eurodollar market breaks. If the cycle gets out of hand, as it did from 2008 onwards, banking solvency is not only limited to local emerging market banks, but to the international banking community at large.
Taking a closer look at the previous dollar cycles, as represented by the realbroad based dollar index we find that the initial shock pushes the dollar 20 – 25% higher from its low. It then pauses, drops 5% before starting a second leg higher (we outlined this process back in October). This is exactly where we are at now and if history repeats itself, which we believe it will, a new financial crisis is brewing just under the surface as the dollar moves into its second leg.

There are also other compelling arguments for the strong dollar case. If President-Elect Trump moves forward with his policy promises, such as changing the tax-system in accordance with the principle of destination based taxation; exports will be tax exempt, while imports will fully taxed at the corporate rate. The dollar may strengthen as much as 10 – 15% on this tax alone. Furthermore, if American companies repatriate some of their trillions held abroad it will put additional pressure on the price of dollars. Some may argue that dollars held in Wall Street are just as fungible as those held in Tokyo, Hong Kong or London, but given new money market regulations that may no longer be the case. Prime funds are starved of cash, while those investing in government bills are flush. It is therefore highly likely that repatriated cash will be stuck in New York money markets and create additional pressure on Eurodollar markets.

In Toward a New World Order, Part III we showed several structural breaks occurring in US economic time series after 2008. Similar breaks can be found throughout the world. These are all directly related to a broad based funding problem stemming from Eurodollar scarcity and a higher price of the dollar. While dollar-QE interrupted this downward trend intermittently, it was never a solution to the problem, which is one of misallocation of capital and malinvestments. QE only help fund capital consuming economic activities, commonly referred to as bubbles, and as soon as QE injections stop, capital reallocation toward a sustainable economic constellation resumes. QE is thus an extremely destructive policy as it depletes an already stretched pool of real savings available to fund economic projects.
We created a proxy for the state of the Eurodollar by summing up balance sheets of major European banks and what that simple exercise reveals is not a recession and weak recovery, but the ongoing depression that has been so detrimental to Western economies for the last ten years.
Our Eurodollar proxy peaks with the financial crisis, falls rapidly despite QE1 (which was a more technical program designed to fund shadow banks within the US and didn’t really increase the supply of dollars globally), but recovers slightly during QE2 with its focus of pushing dollars into the global system. It is interesting to note how different the proxy reacted to QE3, a program designed just as QE2.

Our proxy showed tentative signs of a global financial system finally able to adjust to the new reality. By late 2015 the Eurodollar market had stabilized. Forced by unforgiving market forces and zealous regulators, banks increased their capital ratios and scaled down. However, just as the system started to cope, our money masters in their infinite stupidity decided they wanted to force banks to re-leverage their balance sheets again in what can only be interpreted as a schizophrenic Leviathan; regulators (often within the central bank itself) told banks to deleverage, while central bank policies tried to make banks leverage. We are of course talking about negative interest rates. By charging banks to hold their excessive reserves at the central banks, the idea was that banks would feel compelled to invest money in the main street economy.
As is now clear to all, maybe with the exception of the Ph.Ds. polluting the world central banking community, negative interest are a deflationary force in itself. Yield curves crashed, net interest margins were squeezed, and with Main Street at peak debt, there have been little appetite for more debt. It has been such an abject failure that the Bank of Japan have more or less admitted their mistake by introducing yield curve control. That step was originally an attempt to steepen the yield curve, but has since backfired spectacularly as the JGB 10-yr rushed through the zero percent level with the election of Donald J. Trump for the US Presidency. Now they are forced to put a lid on JGBs in order to maintain the zero target.
Lastly, if the US current account deficit shrinks, as tariffs and arm-twisting make US Inc. think twice about moving production abroad or even re-shoring some of their existing capacity and a resurgent shale oil industry increase oil production on back of OPEC jawboning, the global dollar supply / demand imbalance will only be aggravated.
In 2017 we expect the dollar to gain another 10 – 20%. This will create immense pressure in several emerging markets such as Turkey, South Africa, Indonesia, Brazil and India. While they have managed to reduce their current account deficits considerably, large amounts of dollar denominated liabilities need to be rolled over in 2017. The US, which currently experiences a mini-boom on the anticipation of Trump policies on top of large dollops government spending prior to the election, will head into recession as the Trump-amplifier turns out to be a dud. Deflation expectations re-emerge to the great surprise of most pundits, but a US led deflation will be nothing compared to what the inevitable Yuan devaluation (or stronger pace of depreciation) will create; in this respect, the German economy, with its heavy reliance on capital goods exports, looks particular vulnerable.
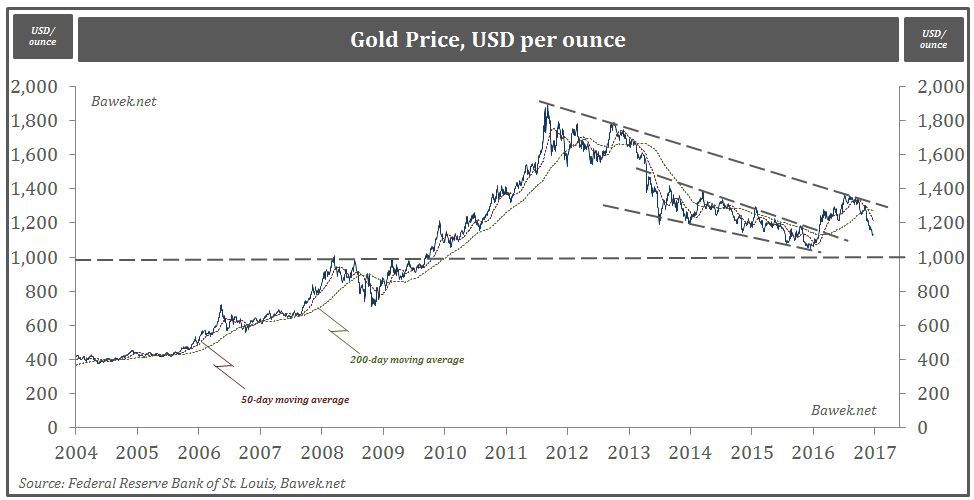
We expect gold to fall below USD1.000 per ounce (which will be a great buying opportunity).
Crude oil will probably fall into the low USD20s per barrel as the OPEC-deal fails to materialize and demand projections prove too optimistic. If OPEC fully comply with the announced deal inventories will start falling in Q1 2017 and provide data oil traders will justify further bullishness. In other words, short term, crude may move higher on OPEC and Trump, but in the medium term it is highly likely the glut will persist and pull the rug under all the bullish bets out there.
However, if OPEC cheats only 5% from the announced deal the first inventory drawdown will be postponed one year, and the cumulative inventory overhang will persist well into the 2020s.
Yield steepeners are in vogue today, but if the dollar thesis plays out as expected, you should load up on cheap yield flatteners in the “safe havens”.
The most important and interesting question though is this; what will the Fed do when they realize that their hiking cycle triggers the global risk-off trade? QE4? At that point everything we just said changes. QE4 will probably be the sign that velocity is about to take off and create the dreaded deflation-inflation whip-saw we expect over the longer term.
Abrazos,
PD1: No dejes de ver el discurso entero de 10 minutos de Trump en su jura presidencial (https://www.youtube.com/watch?time_continue=12&v=lRRd10JjkBA). Interesante la declaración de intenciones que tendrá muchas repercusiones económicas. Vamos a tener unos años complicaditos…, sobre todo para los europeos que nos quedamos solos sin su abrigo y sin el tirón de su economía… EEUU nos deja solos, el Reino Unido también, ¿habrá otros? Puede. Ay del euro, ay!!
PD2: La importancia de apoyarnos en la que queremos: Por muy dura que sea la vida, siempre habrá alguien a tu lado que hará todo lo posible para conseguir que sonrías. Ojalá siempre tengamos cerca a alguien a quien decirle: Te quiero a ti con todo incluido: tus defectos, tu pasado, tus errores, tu sonrisa, tus bromas, tu sarcasmo, tus celos, tus enojos…


