30 diciembre 2016

predicciones de 2017

Este año no pensaba poner ninguna, ya que siempre se equivocan, pero os suelto solo una:
There’s a lot to be worried about going into 2017 both in terms of financial markets and in terms of geopolitical concerns.
Globaly, SocGen's latest quarterly "Swan Risk" chart points out that China is the big "'pure' economics" risk in the G5, with the "most significant risks with pockets of significant excess in housing, high debt levels and a burgeoning NPL problem," and thus they see the risk of a hard landing at 20%. Taking it one step further, they added that "insufficient" structural reform "leaves the economy at very significant risk of a lost decade, which we set at a 40% probability."
Broader political risk remains a major threat, conjoining the numerous upcoming European elections, potential spillover from policy uncertainty in the EU, and "significant uncertainty" regarding future US policy (with Europe the most concerning).
Finally they argues that bond yields are the "Achilles' heel of global markets," pointing out that "market pricing on Fed rate hikes, however, remains modest and there is to our minds significant risk of a more disorderly repricing of global bond yields. Such a scenario could have very negative spillover, not least to emerging markets."
First, as Goldman warns, while investors have been focusing on the prospect of a lower statutory corporate tax rate, the firm's US economist Alec Phillips notes that it will likely come with provisions that will offset much of the benefit of a lower rate. For instance, under the House Republican plan, several corporate tax incentives, such as the interest expense deduction, would be repealed. Furthermore, the plan proposes a redefinition of foreign and domestic income based on where sales, rather than production, occurs. Furthermore, under Mr. Trump’s plan, the deficit as a percentage of GDP  would jump from 3.2% in 2016 to 5.0% in 2017 and 6.1% in 2018. The annual deficit will rise from a projected $590 billion in 2016 to $960 billion in 2017 and $1.2 trillion in 2018. Our US economics team has a more restrained baseline forecast that projects the deficit as a percentage of GDP will be 3.4% in 2017 and 4.0% in 2018 while the deficit will total $650 billion in 2017 and $800 billion in 2018.
Second, another key risk of President-elect Trump’s proposed economic policies is higher inflation. Realized measures of inflation have steadily risen in recent months. Core CPI now stands at 2.2% while  core PCE, the Fed’s preferred inflation metric, has risen to 1.7% from 1.3% last year (see Exhibit 24). At the same time, reduced labor market slack has supported wage growth and our GS Wage Tracker stands at 2.6%, its highest level post-crisis (see Exhibit 25).
Third, the bond market has started to price in a macroeconomic landscape of higher inflation and interest rates. Ten-year forward inflation expectations rose by 20 bps to 1.9% in just two weeks following the election (see Exhibit 26). Higher expected inflation has pushed 10-year nominal interest rates to 2.3%, an increase of 50 bp in just a few weeks. Looking forward, Goldman's Economics team and the  market expect bond yields will rise in 2017. Additionally, Goldman expects the short end and long end of the yield curve will rise faster than currently priced by the market (see Exhibit 27). In other words, the Fed is now behind the curve, pardon the pun.
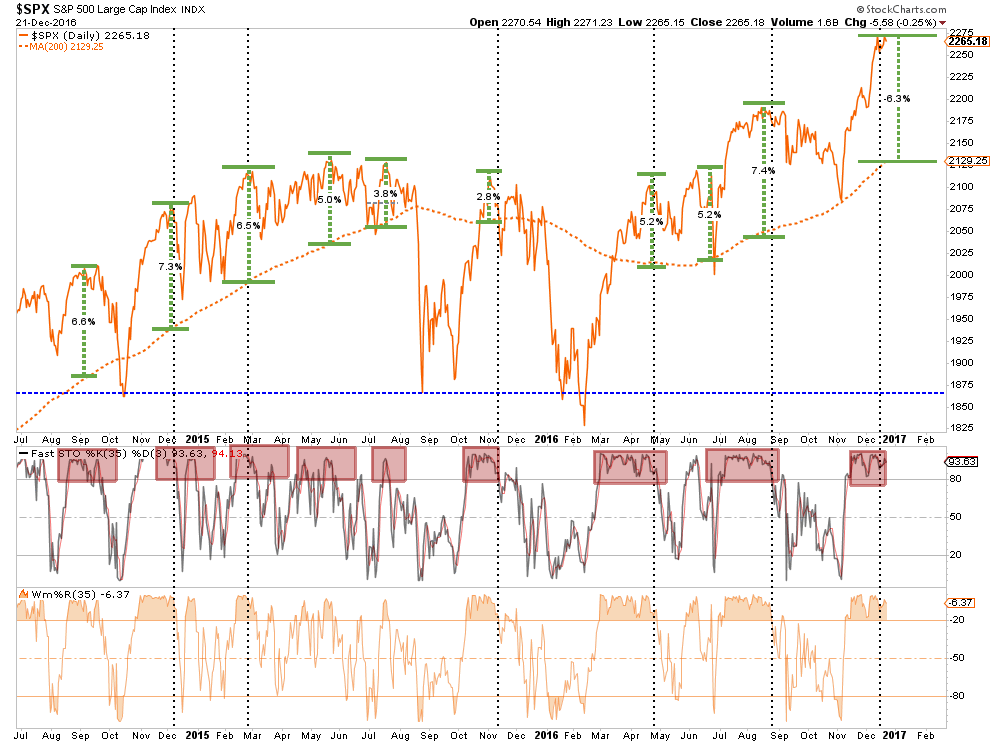
Fourth, with the 10Y yield coming just shy of 2.50% on Thursday, financial conditions as dictated by the bond market are tight enough to start pressuring stocks. Recall that as Goldman also explained last week, "a rise in US bond yields above 2.75% would create a more serious problem for equity markets: at that point we would expect the correlation between bonds and equities to be more positive - i.e., any further rises in yields from there would be a negative for stock returns."
Fifth, as inflation expectations and yields rise, Goldman expects higher realized inflation and interest rates will restrict any S&P 500 valuation expansion during 2H 2017. The S&P 500 forward P/E has  already increased by 71% since September 2011, growth surpassed only by the 1987 cycle (112%) and the Tech Bubble (115%). Historical P/E expansion cycles are usually accompanied by falling interest rates and falling inflation while Goldman now projects both bond yields and inflation will rise during the next several years (see Exhibit 28). Although the S&P 500 trades at roughly fair value relative to history given core CPI of 2.2%, higher inflation is typically associated with a lower forward P/E multiple (see Exhibit 29).
Sixth, higher bond yields are usually associated with a lower forward P/E multiple. Since 1976, the average forward P/E multiple when the 10-year US Treasury ranges between 2% and 3% is 14.2x. However, the S&P 500 currently trades at 17.1x forward bottom-up consensus EPS and we expect some downside risk to the multiple as bond yields continue to rise during 2017.
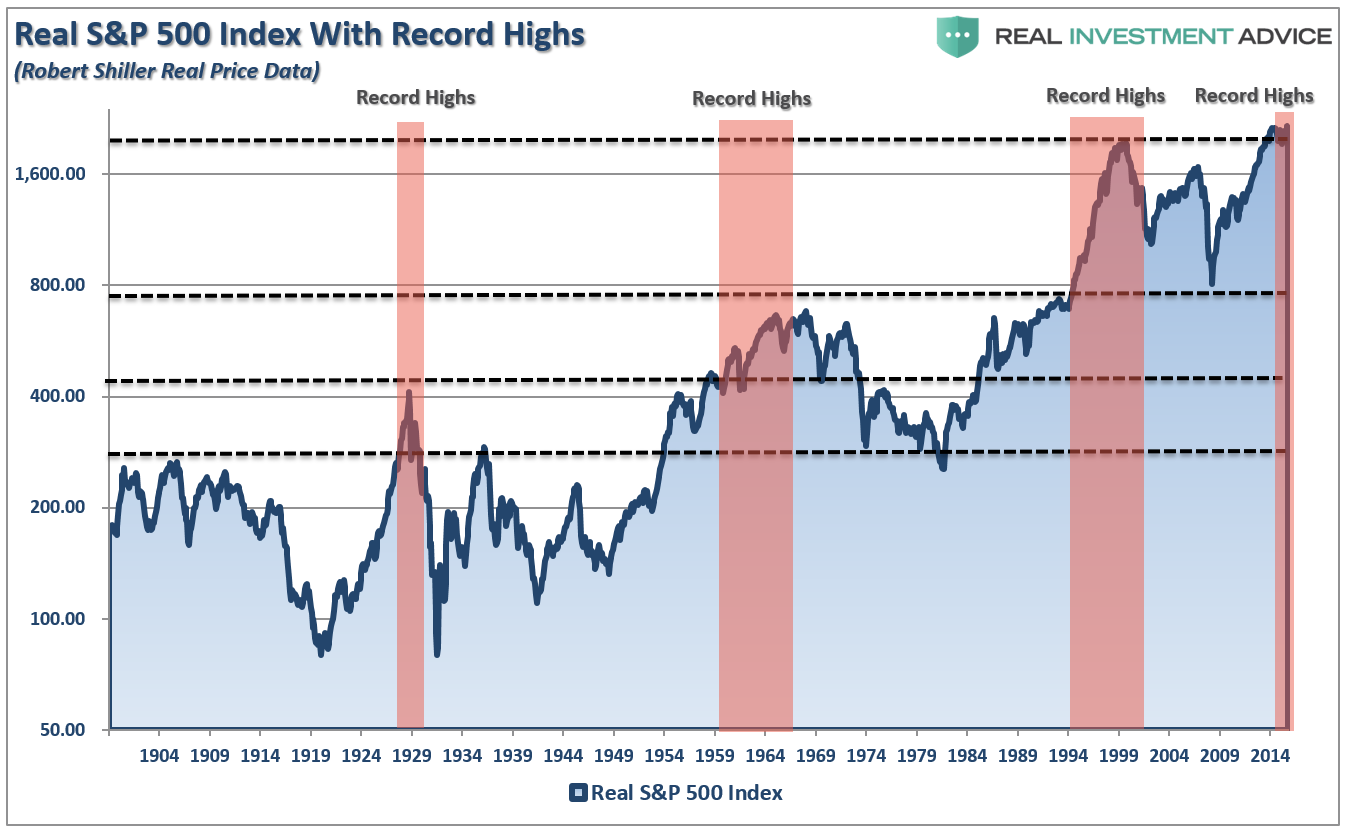
Seventh, and last, despite Goldman's recent bout of euphoric optimism, predicated only by the outcome of a presidential election which, as Goldman itself said, is very much unclear, the firm clearly admits that, and we quote, "S&P 500 valuation is stretched relative to history on nearly every fundamental metric. At the aggregate level, the S&P 500 index trades at the 85th percentile of historical valuation relative to the past 40 years. For portfolio managers, the more important fact is that the median S&P 500 company trades at the 98th percentile of historical valuation (see Exhibit 33)."
... So you're saying there is a 2% chance?
Abrazos,
PD1: This is the top…
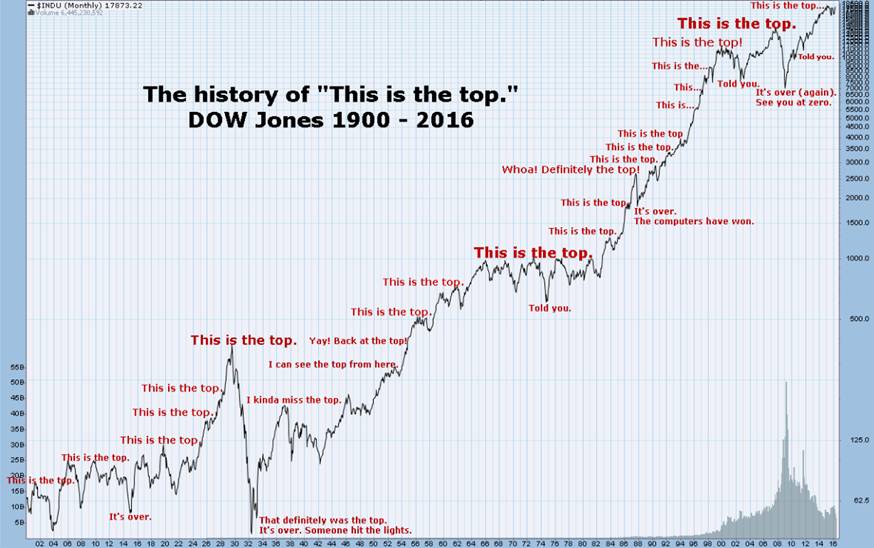
Verás que los agoreros siempre se equivocan… Hay correcciones, pero son para seguir subiendo después…
PD2: Propósitos de Año Nuevo:

Época de buenos deseos

Sí, la Navidad es época de buenos deseos. Pero también tenemos la experiencia de que los buenos deseos de la Navidad rara vez duran más allá de las primeras semanas de enero. Supongo que esto se debe a la falta de virtudes. Una virtud tiene un componente digamos intelectual, otro emocional y otro volitivo.
El aspecto intelectual nos dice por qué hemos de hacer algo: por qué he de ser leal, sincero, humilde… por qué he de perder peso, ser más ordenado, vivir mejor la puntualidad… sonreír más frecuentemente, interesarme por las cosas de los demás… Ese conocimiento nos ayudará a tomar una buena decisión: si no sabemos por qué la tomamos, o no estamos convencidos de que eso es bueno, el propósito no durará mucho.
El emocional sirve de espoleta, de detonador. Ver el sufrimiento de un niño nos llama a la generosidad; sentir la vergüenza de que nuestros amigos vean el desorden de nuestra oficina nos animará a ordenarla. Pero lo más probable es que ese empujón dure poco. Si es de una sola vez, porque no nos acordamos más; si es muy frecuente, porque nos aburre o nos endurecemos o perdemos sensibilidad. Habitualmente, el subidón emocional tiene que traducirse inmediatamente en una reflexión y estudio y, muy muy pronto, en una decisión. Por eso los que venden por internet o por televisión te dicen que compres ahora, o que llames ahora. Pero a ellos les preocupa poco la continuidad: y eso pertenece a la tercera dimensión.
Porque la clave está en la dimensión volitiva: debo hacer tal cosa, y estoy decidido a hacerlo, y a hacerlo ya, poniendo toda la carne en el asador. Hay trucos que nos pueden servir. Uno es el examen frecuente. Otro, pedir la ayuda de alguien que nos exija o nos controle (antiguamente la gente ahorraba durante el año para tener dinero para las compras de Navidad, y lo hacía ingresando el dinero en alguna institución, con el encargo explícito de no devolver el dinero antes de, digamos, el 15 de diciembre). Es muy bueno fijarse metas pequeñas, muy concretas y a muy corto plazo. ¿Quieres ser más amable? Vete ahora a la oficina de al lado y pregunta a quien está allí cómo está, qué va a hacer en estas Navidades, si todos están bien en casa, etc. Y luego ponte otro objetivo para dentro de un rato, cuando llegues a casa; y para más tarde, cuando tengas tiempo para llamar a tu primo con quien no te llevas bien…  ¡Ah!, y como esto no durará mucho, vuelve a empezar. Otra vez. Sí, ya sé que has fracasado en los últimos veinte intentos, pero vuelve a empezar. Porque -y aquí está la clave- has de adquirir el hábito operativo de lo que sea: ser amable, bajar peso, sonreír siempre…
Y, si eres creyente, reza por esa intención. Esto tiene tres objetivos. Uno, ganarte la cooperación de alguien más, Dios en este caso, que te ayudará. Y otro, convencerte tú de que no estás solo, o sea, de que tienes esa ayuda externa, y la tienes aunque no la notes, aunque se retrase… Y también para implicar a otros, cuando, por ejemplo, pides ayuda a Dios para ser tú más ordenado, pero también para que tus hijos sean más ordenados, de modo que tú debes luchar porque quieres ser ordenado y también porque quieres que tus hijos sean más ordenados y, claro, no los puedes dejar solos, no puedes fallarles. O sea que… a luchar, porque ahora ya no lo haces solo por ti, sino, sobre todo, por ellos.
Sí, la Navidad es una época de buenos deseos. Pero algunos son eficaces y otros no. Es ley de vida. Lo importante es que no te desanimes. Porque, ya te lo digo ahora, te morirás desordenado, mal carado, impuntual o lo que sea, pero te morirás feliz, porque habrás pasado unos cuantos años de tu vida intentando ser mejor. Y, a diferencia de las olimpiadas humanas, el premio -la felicidad en esta tierra, y luego en la otra- no se promete al que siempre triunfa, sino al que sigue intentándolo hasta un rato antes de morir. ¿No te lo crees? Bueno, haz la prueba, y cuando llegues a la otra vida ya me contarás tu experiencia. La felicidad no es una hoja de servicios intachable y, por tanto, imposible, sino la humildad de volver a intentarlo cada día. Y esto está al alcance de todos.
En la Navidad los cristianos recordamos el nacimiento de un Niño, que era -que es- Dios. Lo que él nos trajo no es la promesa del éxito, sino la seguridad de que, si lo intentamos una vez y otra, al final lo conseguiremos. Y, entre tanto, nos habremos hecho mejores, porque -y esto forma parte del mensaje que nos dejó aquel Niño- nos hacemos mejores cuando tratamos de hacer mejores a los demás.

29 diciembre 2016

¿mercado alcista o bajista?

Esa sensación de que tras las elecciones USA, la euforia ha sido desmedida… ¿Qué va a pasar ahora? Hay un enorme debate entre alcistas y bajistas. Unos apuestan que con las medidas que adoptará Trump se conseguirá un mayor crecimiento del PIB y que dará alas a las bolsas de EEUU para continuar la subida, aunque sea a otro ritmo. Otros opinan que viene una consolidación, que el acumulado de los últimos años y las valoraciones no son atractivas. Y todos confirman la poca rentabilidad alternativa, los riesgos de los bonos, las dudas que surgen en la guerra de divisas en la búsqueda de competitividad… Este es el debate entre alcistas y bajistas:
I have written over the last couple of months the market was likely to rally into the end of the year as portfolio managers, hedge, and pension funds chased performance and “window dressed” portfolios for year-end reporting purposes. As I noted in this past weekend’s missive:
“I still suspect there is enough bullish exuberance currently to push the Dow to 20,000 and the S&P to 2,300 by the end of the year. However, I am more concerned about what I believe may occur after the inauguration in January.
I have discussed previously the importance of ‘price’ as an indicator of the market ‘herd’ mentality. One of the major problems with the fundamental and macro-economic analysis is the psychology of the ‘herd’ can defy logical analysis for quite some time. As Keynes once stated:
‘The markets can remain irrational longer than you can remain solvent.’
Many an investor have learned that lesson the hard way over time and may be taught again in the not so distant future. As shown in the chart below, the momentum of the market has decidedly changed for the negative.Furthermore, these changes have only occurred near market peaks in the past. Some of these corrections were more minor; some were extremely negative. Given the current negative divergences in the markets from RSI to Momentum, the latter is rising possibility.”
Despite this technical deterioration and excessive price extension, the “bullish vs. bearish” argument continues.
Let’s examine both arguments.

The Bullish Bias

The bulls currently have the “wind at their backs” as the exuberance mounts the new administration will foster in an age of deregulation, infrastructure spending and tax cuts that will be boost corporate earnings in the future. As Jack Bouroudjian via CNBC wrote:
“Let’s be clear, this market run up to the 20K level has a much more solid foundation for valuation. We are not looking at a P/E which has been stretched beyond historic norms as was the case in 1999, nor are we looking at a dot com bubble ready to implode. On the contrary, between digestible valuations and the prospects of real pro-growth policies, we have the foundation for a run up in equities over the course of the next few years which could leave 20K in the dust.
One of the great lessons in the market is that when ‘Animal Spirits’ take control, one must simply go with it. It’s not easy to recognize a paradigm shift, in fact many can only realize the phenomenon after the fact. The Trump victory coupled with the sweep in congress makes this a classic paradigm shift and the financial world needs to embrace it.
The dark days of wasted revenue and liberal tax and spend policies is giving way to an era of fiscal stimulus and pro-growth legislation not seen in 30 years. All this is coming at a time when corporate America, sitting on mountains of cash both domestically and overseas, find itself on the brink of a digital revolution.
Over the course of the next few years, corporations should see top line growth and expanding operating margins. With the understanding that equity prices move on expectations, one must conclude that the rally we have experienced over the last few weeks might be the ‘tip of the iceberg’ when it comes to the move we will see in the coming years.”
This, of course, is just the latest iteration of the “bull argument.”  Previously it was Federal Reserve liquidity, low interest rates, and low inflation were good for stocks. Now, it is higher interest rates and inflation is good for stocks. In other words, there is apparently no environment that is bad for stocks. Right?
As shown below, the bullish trend has remained firmly intact since the onset of QE1 which brings two Wall Street axioms into play:
1) Don’t Fight The Fed
2) The Trend Is Your Friend
Since the primary goal of the Federal Reserve’s monetary interventions was to boost asset prices, in order to stimulate economic growth, employment, inflationary pressures and consumer confidence, there is little argument the Fed achieved its goal of inflating asset prices. The “bulls” drank deeply from the proverbial “punch bowl.”
The continuous and uninterrupted surge in asset prices has driven investors into an extreme state of complacency. The common mantra is the “Fed will not let the markets fall” has emboldened investors to take exceptional risks. The chart of volatility shows again that bulls remain clearly in charge of the markets currently with the “fear of a correction” at near historic lows.
We can see the same level of bullishness when looking at the levels of “bearish” ratio of Rydex funds. (Bear Funds + Cash Funds / Bull Funds)
In other words, since investors have little fear of a correction, they have now gone “all in” following the election.
Lastly, since the election, investors confidence has soared as discussed by Evelyn Cheng via CNBC this week:
“Individual investor optimism jumped to a nine-year high in November, according to the Wells Fargo/Gallup Investor and Retirement Optimism Index published Tuesday.
The last time the index approached the November level was before the financial crisis, in May 2007 with a read of 95, the report said. The index was at 103 in January 2007.”
There is little doubt the “Bulls are back.” With the markets pushing all-time highs heading into the 9th year of a bull market, the belief is the momentum is set to continue. In fact, there isn’t a “bear” in sight:
“The unexpected election last month of Donald J. Trump as president has been a game changer for the 10 investment strategists whose market outlook Barron’s solicits twice each year. As stocks took off on Nov. 9 and thereafter, fueled by investors’ enthusiasm for Trump’s expected pro-growth agenda, even our group’s bears turned bullish.“

The Bearish Perspective

While the bulls are pushing a continuation of the market based on “hopes” and “expectations,” the bears are countering with a more rational and pragmatic basis.
Valuations, by all historical measures, are expensive. While high valuations can certainly get higher, it does suggest that future returns will be lower than in the past.
That statement of “lower future returns” is very misunderstood. Based on current valuations the future return of the market over the next decade will be in the neighborhood of 2%. This DOES NOT mean the average return of the market each year will be 2% but rather a volatile series of returns (such as 5%, 6%, 8%, -20%, 15%, 10%, 8%,6%,-20%) which equate to an average of 2%.
Of course, as discussed previously, investor behavior makes forward long-term returns even worse.
The bulls have continually argued that the “retail” investor is going to jump into the markets which will keep the bull market alive. The chart below supports the bear’s case that they are already in. At 30% of total assets, households are committed to the markets at levels only seen near peaks of markets in 1968, 2000, and 2007.  I don’t really need to tell you what happened next.
The dearth of “bears” is a significant problem. With virtually everyone on the “buy” side of the market, there will be few people to eventually “sell to.” The hidden danger is with much of the daily trading volume run by computerized trading, a surge in selling could exacerbate price declines as computers “run wild” looking for vacant buyers.
This thought dovetails into the “hyperextension” of the market currently. Since price is a reflection of investor sentiment, it is not surprising the recent surge in confidence is reflected by a symbiotic surge in asset prices.
The problem, as always, is sharp deviations from the long-term moving average always “reverts to the mean” at some point. The only questions are “when” and “by how much?”

Managing Past The Noise

There are obviously many more arguments for both camps depending on your personal bias. But there is the rub. YOUR personal bias may be leading you astray as “cognitive biases” impair investor returns over time.
“Confirmation bias, also called my side bias, is the tendency to search for, interpret, and remember information in a way that confirms one’s preconceptions or working hypotheses. It is a systematic error of inductive reasoning.”
Therefore, it is important to consider both sides of the current debate in order to make logical, rather than emotional, decisions about current portfolio allocations and risk management.
Currently, the “bulls” are still well in control of the markets which means keeping portfolios tilted towards equity exposure.  However, as David Rosenberg recently penned, the markets may be set up for disappointment. To wit:
“In fact, despite base effects taking the year-over-year trends higher near-term, I think we will close 2017 with consumer inflation, headline and core, below 1.5% (though both will peak in the opening months of the year at 2.6% and 2.3% respectively).
The question is what sort of growth we get, and as we saw with all the promises from ‘hope and change’ in 2008, what you see isn’t always what you get.
There are strong grounds to fade this current rally, which has more to do with sentiment, market positioning and technicals than anything that can be construed as real or fundamental. There is perception, and then there is reality.”
Currently, there is much “hope” things will “change” for the better. The problem facing President-elect Trump, is an aging economic cycle, $20 trillion in debt, an almost $700 billion deficit, unemployment at 4.6%, jobless claims at historical lows, and a tightening of monetary policy and 80% of households heavily leveraged with little free cash flow. Combined,  these issues will likely offset most of the positive effects of tax cuts and deregulations.
Furthermore, while the “bears” concerns are often dismissed when markets are rising, it does not mean they aren’t valid. Unfortunately, by the time the “herd” is alerted to a shift in overall sentiment, the stampede for the exits will already be well underway. 
Importantly, when discussing the “bull/bear” case it is worth remembering that the financial markets only make “record new highs” roughly 5% of the time. In other words, most investors spend a bulk of their time making up lost ground.
The process of “getting back to even” is not an investment strategy that will work over the long term. This is why there are basic investment rules all great investors follow:
1-Sell positions that simply are not working. If they are not working in a strongly rising market, they will hurt you more when the market falls. Investment Rule: Cut losers short.
2-Trim winning positions back to original portfolio weightings. This allows you to harvest profits but remain invested in positions that are working. Investment Rule: Let winners run.
3-Retain cash raised from sales for opportunities to purchase investments later at a better price. Investment Rule: Sell High, Buy Low
These rules are hard to follow because:
1-The bulk of financial advice only tells you to “buy”
2-The vast majority of analysts ratings are “buy”
3-And Wall Street needs you to “buy” so they have someone to sell their products to.
With everyone telling you to “buy” it is easy to understand why individuals have a such a difficult and poor track record of managing their money.
As we head into 2017, trying to predict the markets is often quite pointless. The risk for investors is “willful blindness” that builds when complacency reaches extremes. It is worth remembering that the bullish mantra we hear today is much the same as it was in both 1999 and 2007.
I don’t need to remind you what happened next.
Otra aproximación interesante:
As I look out over the coming years, I am convinced that we’ll see the blowing up of the biggest bubbles in history - including those of government debt and government promises. And it’s not just in the US, but all over the world.
That will lead to an eventual global crisis of biblical proportions. Although, it isn’t clear what the immediate cause of the crisis will be.

Let’s start with some basics

The most common way to measure valuation is with the price-to-earnings ratio (P/E). Analysts compile P/E and other indicators from many companies to give us valuation metrics on entire markets and indexes.
You can see overvaluation and undervaluation in this chart from my friend Ed Easterling of Crestmont Research.
The red line is the combined P/E ratio of the S&P 500 as originally reported. The green and blue lines are adjusted Crestmont and Shiller versions, which occasionally diverge. The P/E ratio spent most of the last century between 10 and 25.
Presently, all three P/E versions are near or above 25, indicating overvaluation. This doesn’t mean the end is near—though it could be. But it does suggest that we are not at the beginning of another long-term bull market.

P/E adjusted to economic growth

The next chart illustrates the past and present trend in a different way.
Direct your attention to the dashed line.
It’s Ed’s long-term earnings baseline, which he adjusts to reflect the relationship of earnings to economic growth. Reported earnings per share go below the baseline during bear markets and above it in bullish periods. Currently, it is way above trend and is projected by S&P and many others on Wall Street to become even more so.

The Buffett indicator

The Buffett Indicator is essentially the market value of all publicly traded securities as a percentage of GDP. Intuitively, it seems odd that the combined value of every public stock would be worth more than the country’s annual production. But sometimes it is. Those periods tend to mark overvaluation, as you can see here.
The interesting thing here is that right now, the Buffett Indicator—while down from its late 2014 peak—is still higher than it was before the 2008 financial crisis. That should not be encouraging if you’re a bull.

S&P 500 median since 1964

The next chart is from Ned Davis and shows us the S&P 500 median P/E back to 1964, which is 16.9 (dotted green line). The distance we are above or below the median is a valuation clue.
Could the market get more overvalued? Absolutely. It did in the tech bubble.
Y otra más:

Household equity percentage vs. S&P 500 total return

The following chart takes some explaining.
It shows the percentage of household financial assets invested in stocks (blue line) versus the S&P 500 total return for the following 10 years (dotted line).
Notice that the right axis is inverted and the dotted line tracks pretty close to the solid blue one. The correlation is 0.91, which is extraordinarily high.
What the chart shows us is that a higher percentage of household assets in equities points to a lower annualized return over the next 10 years.
Note the green arrow at the 2009 low. It points off to the right scale just below 15. That suggests that someone who bought stocks at that low point and holds them until 2019 will realize a roughly 15% annualized return.
That’s the good news. The bad news is that the red arrow at 6-30-2016 means that the 10 years ending 6-30-2026 should produce a 3.25% annual gain. That’s not awful, of course, but it is nowhere near the 7% or more that many pensions and insurance companies think they can earn on their portfolios.

We are way overdue for a correction

Bottom line: We are way overdue for a correction. Again, our situation is not the worst it’s ever been, but we are beginning to bump up against historical lines in the sand.
Here’s the chart, which shows the number of days before the start of 5%, 10%, and 20% corrections.
Here is how you read this chart:
The top section shows the history of the S&P 500 Index from 1928 to present. The next three sections show the number of days prior to the start of 5%, 10%, and 20% corrections.
I think we are still in a very long-term secular bear, although there has been a clear cyclical bull market since 2009. I think the next global recession (hopefully not a depression) will potentially give us a vicious bear market that will mark the end of this secular bear.
You can see that it has been 116 days since we had a 5% correction. Since 1928, the average number of days before a 5% correction occurred was 50. In secular bull periods, the average number of days was 84. In secular bear periods, the average number of days was 31.
Note that we have been 210 days without a 10% correction. Since 1928, the average number of days before a 10% correction occurred was 167. In secular bull periods, the average number of days was 331, while in secular bear periods, the average number of days was 91.
It has been 1955 days since we suffered a 20% correction. Since 1928, the average number of days before a 20% correction occurred was 635. In secular bull periods, the average number of days was 1105. In secular bear periods, the average number of days was 486.
The current case of 1955 days without a 20% correction is more than three times the average of 635 days (for the whole period from 1-3-1928 to 12-8-2016).
For this record number of days, let us all join hands and exclaim, “Thank you, Fed, BOJ, and ECB!”
Abrazos,
PD1: Tengamos una caridad afectuosa, que sepa acoger a todos con una sincera sonrisa. Qué cansino es el mundo lleno de siesos…
Ante las dificultades, los problemas, las tragedias, también en la multitud de pequeñas cosas penosas diarias que pasan por nuestro camino, requieren un corazón atento, que quite relevancia a lo que realmente no la tiene, y que se esfuerce por darla a lo que verdaderamente importa.
Siempre, mostremos nuestra sonrisa, nuestro sosiego y nuestra paz.