DEFINITION of 'Blow-off'
A term in technical analysis that refers to a sharp price increase that comes after a long period of price appreciation, and is followed by a fall in the price. A blow-off is seen as a rally's last breath and is a highly bearish sign.
¿Se repetirá la historia? Espero que no sea así ahora...
Defying Expectations
Why is the stock market seemingly so utterly oblivious to the potential dangers and in some respects quite obvious fundamental problems the global economy faces? Why in particular does this happen at a time when valuations are already extremely stretched? Questions along these lines are raised increasingly often by our correspondents lately. One could be smug about it and say “it’s all technical”, but there is more to it than that. It may not be rocket science, but there are a few issues that are probably not getting the attention they deserve.

The stock market has blown widespread expectations out of the water by embarking on a seemingly unstoppable rally since Donald Trump was elected POTUS.
As you can see below, we have marked “Brexit day” on the chart as well, which was another noteworthy juncture. Not only was the success of the “Leave” campaign just as big a surprise as Trump’s election victory, but it was yet another occasion on which the market ended up fooling most observers by dramatically reversing course after a mere two days of relatively mild panic selling.

DJIA, daily. Since the US presidential election, the stock market has rallied relentlessly, after breaking through a long-standing resistance level with ease. The move since then is increasingly looks like a blow-off rally, and we think that is precisely what it is – click to enlarge.
Not to belabor the obvious too much, but it is actually a hallmark of bull markets that they ignore any and all bad news. In fact, bad news quite often end up extending the lives of bull markets, not least because they help with sustaining a certain degree of skepticism among market participants. To be sure, at times that is not the only reason. In the “Brexit” case we have little doubt that the reaction of central banks to the outcome of the referendum played a big role in the market reversal.
We have discussed the market’s post-election performance before, but here is a reminder of how deeply ingrained the views about the likely effects of a Trump victory on the stock market were. As the probabilities shifted toward Trump winning on election night, DJIA futures intermittently fell by more than 900 points in Asian trade. Many Trump opponents felt compelled to remark on this without awaiting further developments.
Paul Krugman for instance made an especially ambitious forecast that was shredded within a few hours:
“It really does now look like President Donald J. Trump, and markets are plunging. When might we expect them to recover? […] I guess people want an answer: If the question is when markets will recover, a first-pass answer is never.”
Admittedly we like poking fun at Paul Krugman. That is however not the point here, the opportunity to pick on Krugman is merely an agreeable side effect. The point is that his comment is an excellent illustration of the expectations prevailing at the time. Our own forecast was by no means better – we did map out possible near term paths for the market depending on the election outcome, but none of these assigned a very high probability to a blow-off rally, even if the possibility was at the back of our mind some time ago already.
We have previously stated that we believe the overnight reassessment of the market’s prospects after the election was inter alia motivated by the Republican party’s “clean sweep”, i.e., the fact that in addition to its candidate becoming president, it managed to win majorities in the House and Senate as well. That made it more likely that Trump would be able to enact his economic policies and wouldn’t have to face a hostile Congress. That was likely the immediate trigger, but not the main driver of what has happened since then.
The Fundamental Driver of the Blow-Off Rally in Stocks
Stock prices have been driven to valuations that seemingly make little sense from a fundamental perspective. We believe the main culprit was way above-average money supply growth over the past eight years. What we are seeing now are partly its lagged effects; its pace actually remains quite brisk, but it has begun to slow down noticeably and that seems set to continue. The recent market action displays a number of characteristics typically associated with a final rally phase.
What we say about the stock market below is premised on certain basic assumptions – the most important ones are the following:
1. the market’s long term returns will continue to adhere to historical precedents, which is to say, in the long term valuations will fluctuate with some regularity over a fairly wide range. The boundaries of this range are certainly not fixed, but market history does provide a few useful indications. What these historical precedents imply is best described by John Hussman – see the following chart:

The expected nominal 12-year return of the S&P 500 index based on gross value added, via John Hussman (the concept is explained here). The current outlook is the worst since the peak of the tech mania. The indicator has been back-tested to 1950, i.e., essentially the bulk of the post WW2 era and has worked quite well so far.
2. the central banks of major currency areas, particularly the Fed, will at least attempt to prevent the emergence of hyperinflation. In other words, if price inflation ever reaches worrisome proportions such as in the late 1970s, we expect its suppression will be prioritized over all other considerations, as happened when Paul Volcker was appointed chairman.
The first assumption depends directly on the second, which we admit may turn out to be incorrect at some point in the future. A number of scenarios is imaginable in which it would have to be reassessed, but these seem unlikely to be relevant in the near to medium term. That may change in a severe enough “economic emergency” situation. We mention this for the simple reason that everything we state below is simply not applicable to nominal stock prices in a hyperinflation environment.

The IBC General Index in Caracas. This index was at 6 points in early 2002 – it is at 37,600 points today. After a recent correction, it has rallied from 27,500 points to 37,600 points in a mere two months. This illustrates that inflation is a far more important driver of stock prices than other inputs. In hyperinflation any considerations about earnings and valuations become utterly meaningless – stocks will rally even if the companies listed on the exchange operate in an economy in total free-fall. The chart of the IBC General is simply a reflection of the collapsing value of Venezuela’s currency – click to enlarge.
The same things that are happening at the moment could be observed in the late stages of the 2003-2007 mini echo bubble and the bubble of the 1990s that preceded it: just as the time arrived when money supply growth and the trend in interest rates showed signs of beginning to deteriorate, a blow-off move got underway (incidentally this also happened in the late 1920s).
Two major phenomena always seem to coincide in these final blow-offs: for oon thing, the lagged effects of the preceding money supply expansion continue to play out. There is for instance a feedback loop between rising asset prices and the amount of money one can borrow using these assets as margin collateral. In short, there is inter alia a self-feeding spiral that is helping to push prices up further. Rising demand for credit to purchase securities is also contributing to upward pressure on market interest rates though, which the Fed is not actively countering at the moment.

Year-on-year growth of TMS-2 (broad true US money supply) and total bank credit. This chart illustrates several things: when the Fed became serious about increasing the pace of monetary pumping in late 2008, money supply growth took off like a scalded cat. Even though it is well below previous peak levels, the growth rate never went much below 7.5% y/y and cumulative growth from the end of January 2008 to the end of January 2017 was 141%, i.e., there is now almost 2 ½ times more money in the US economy than at the beginning of 2008 (you may have noticed that we have somehow failed to become 2 ½ times richer). However, the Fed is no longer expanding its balance sheet – QE has been reduced to replacing maturing debt held by the Fed – and the effect of money market regulations was a one-off event. Hence, money supply growth depends entirely on commercial bank credit expansion at present – and bank credit growth has begun to slow sharply – click to enlarge.
In order for the amount of money sloshing about in the financial sphere to become too small to support further price increases, money supply growth needs to fall below an unknowable threshold, that is a moving target to boot (even if we knew where it is at present, it would shift as time passes). When and whether this happens is determined by real economic activity, the willingness of banks to extend additional loans to the private sector and monetary policy. Note that the borrowing of companies for the purpose of buying back their own stock puts upward pressure on market interest rates as well, ceteris paribus. Over time it should also make banks more reluctant to lend, as they will become worried about the growing risks (even if CEOs ignore them).
New money tends to spread across the economy in a wave-like movement. In the era of QE, it clearly enters financial markets first, but over time, some of it still “leaks out” from there. Low demand for funding in the real economy in an economy that is merely muddling along, perversely supports asset prices, as a smaller amount of money will be allocated to other uses than buying securities and the above mentioned “leakage” will be minimized. As long as enough money remains in the financial sphere to push stock prices higher in theory, they can also be pushed higher in practice.
Market Psychology
The second major characteristic of blow-offs are their underlying psychological drivers. By the time money supply growth actually begins to falter, bull markets are usually quite extended and stocks have been at elevated valuations for quite some time already. Many market participants who took profits and raised cash at an earlier juncture, or didn’t fully take part in the most recent rally phase because they could not bring themselves to buy at these valuations, are in a quandary at this stage.
The market just keeps going up in spite of what their rational assessment told them to expect and they are increasingly under pressure as a result. Some investors employing call-writing or hedging strategies either blow up or are abandoning hedges because they are no longer deemed worth the cost (just as they actually become very inexpensive).
Professional investors are particularly affected by this, as the short term underperformance that necessarily results from hedging and/or holding large cash positions begins to cost them customers. Here are two recent examples illustrating that we have arrived at such a juncture:
Zerohedge recently reported that an open-ended hedged futures strategy fund (HFXAX) was forced out of a large number of S&P 500 call spreads involving a staggering amount of notional value:
“RBC’s Charlie McElligott, who dug deeper into the details behind this move, notes the melt-up in the S&P is the result of “a purported / murky melt-down over the past week in a large trade by a multi-billion Dollar (open-ended) futures fund which sells vol on S&P. Without going into specifics, there is market speculation that the entity is effectively short upwards of ~$17B of SPX (deltas to buy) through selling February expiry upside 1×5 (or 1×4) call spreads.”
The fund’s call-writing strategy has not fared well, to put it mildly:

HFXAX (red line) vs. SPX (black line), performance comparison. Note: there are two sister strategies, HFXIX and HFXCX. The former performed slightly better, while the latter generated an even bigger loss, plunging by 31.5% between late October and late February. Each of the three funds holds slightly more than $4 bn. in assets; that translates into a great deal more notional exposure in futures and options – click to enlarge.
Our friends at INK in Canada recently pointed out to us that Canadian insurer Fairfax Financial recently took a US $2.66 billion loss on closing out its short position – here is a blurb from its annual report explaining the decision:
“Included in realized losses in 2016 was a loss of $2,663.9 million realized in the fourth quarter when the company, recognizing fundamental changes in the U.S. which obviated the need for defensive equity hedges, discontinued its economic equity hedging strategy, closing all of its short positions in the Russell 2000, S&P 500 and S&P/TSX 60 equity indexes effected through total return swaps.”
Quite a few investors have thrown caution to the wind long ago, but the blow-off stage is putting enormous pressure on those who were hitherto cautious or skeptical. Short sellers are only a small group and a highly sophisticated one at that, but at least some of them are likely forced to cover their positions as well.
Retail investors were scared to get back into the market while memories of the last crash were still fresh, but they are finally losing their inhibitions too – the waters are evidently deemed safe again. This is evidenced by a dramatic reversal in fund flows and ETF inflows (e.g. $8.2 billion flowed into SPY alone on a single day last week) and the stunning collapse in Rydex money market fund assets.

The top panel shows the collapse in Rydex money market assets – note that this is well aligned with the no less astonishing decline in the ratio between total stock market capitalization and all retail money market funds combined. Rydex assets an fund flows represent only a very small slice of total market activity, but are nevertheless generally a very good indicator of the mood of retail investors and small traders and we believe of investor psychology in general – click to enlarge.
The Story
The late stage of a stock market bubble is always accompanied by a “story”. For example, in 1999/2000 it was that “demand for technology will grow at X% (insert impressively high number) forever and ever”. Large productivity growth rates were similarly extrapolated and used to rationalize absurd valuations (incidentally the sharp slowdown in productivity growth in recent years is not mentioned very often).
Once the final blow-off stage was underway, this underlying premise was decorated with amusing little side stories, such as e.g. rumors of a “DRAM shortage” (we remember laughing out loud when this was excitedly discussed on TV) and similar unlikely notions; not to mention that traditional valuation parameters were replaced by somewhat silly ideas like “eyeball counts”. The situation is probably no less crazy today, it is merely somewhat less obvious. The most egregious insanity is on display in stocks of unlisted so-called unicorns (and derivatives on them) which trade in private markets.
Up until recently, the main “story” serving to rationalize valuations was unrelenting central bank support (not a completely unreasonable idea). A new story is underlying the current blow-off phase though – namely that Donald Trump, who was once held to cause nothing but “uncertainty”, is going to produce so much economic growth that valuations can be safely ignored. Within a few weeks, he has been repackaged into a kind of supernatural warp drive entity which American voters have lashed to the stock market in their infinite wisdom.
The stories and psychological underpinnings of the late 1990s/ early 2000 blow-off briefly summarized above are representative of every stock market blow-off in history – even if the rationalizations are always slightly different.
For instance, in 1988-1989, we often heard that although Japanese stocks were trading at an insane average multiple of 80, they could not possibly decline due to Japan’s incestuous Keiretsu cross-shareholdings system and the “wall of money” besieging the stock market. As we recall, only very few observers occasionally mentioned that sharply rising interest rates and weakening money supply growth might endanger this happy situation.

The Nikkei from 1987 to 1990. it was the only index that immediately streaked to new all time highs after the 1987 crash (it was also the index least affected by the crash). Once the blow-off phase was underway, Japanese stocks were widely deemed invulnerable. The rationalizations offered at the time are quite interesting in retrospect, especially as some of them were later used to explain the market’s decline! The relentless surge in stock prices in 1988-1989 was no longer supported by money supply growth and interest rate trends.
Blow-Off Pattern Recognition
As noted in Part 1, historically, blow-patterns in stock markets share many characteristics. One of them is a shifting monetary backdrop, which becomes more hostile just as prices begin to rise at an accelerated pace, the other is the psychological backdrop to the move, which entails growing pressure on the remaining skeptics and helps investors to rationalize their exposure to overvalued markets. In addition to this, the chart patterns of stock indexes before and after blow-off moves are displaying noteworthy similarities as well.

“On Margin” – a late 1929 cartoon illustrating the widespread obsession with the stock market at the time. There was just a 10% margin requirement, i.e., investors could leverage their capital at a ratio of 10:1. The demand for margin credit was so strong, that it pushed call money lending rates in New York up quite noticeably. This in turn made it increasingly difficult to maintain extremely leveraged positions.
Why do we assume the current move is a speculative blow-off and not just another “normal” up-leg? The main reasons are the speed and size of the move, the fact that it happens at the tail end of a very sizable advance that has already lasted a full eight years, the chart pattern, and above all, valuations.
The chart below was recently posted by John Hussman – it shows the evolution of five different valuation parameters over the entire post WW2 era. As an aside to this: he estimates that another 12% advance would push SPX valuations to the extremes recorded in 2000. We already seem to have passed the 1929 threshold recently, so this is the only record that remains to be aimed for (that does not mean one should expect it to be reached).

Five different stock market valuation parameters since 1947, via John Hussman. He quotes Benjamin Graham in this context: “Speculators often prosper through ignorance; it is a cliche that in a roaring bull market, knowledge is superfluous and experience is a handicap. But the typical experience of the speculator is one of temporary profit and ultimate loss.”
As you might expect, we can neither predict when the blow-off move will end, nor how far it will go. A rule of thumb worth keeping in mind regarding the pattern is that blow-off moves tend to survive at least one correction. For example, the Nasdaq had an A-B-C shaped correction in January of 2000, approximately in the middle of the blow-off rally.

The 1999 – 2000 blow-off pattern in the Nasdaq: in early 2000 the rally was interrupted by an a-b-c type correction. At the time there were fears about the “Y2K computer bug”, which turned out to be completely unfounded – but they gave the Fed an excuse to open the liquidity spigot in late 1999 in spite of the fact that a mild tightening cycle was underway. The surfeit of short term liquidity provided an extra boost to the blow-off rally – click to enlarge.
The Shanghai Composite had a similar shaped correction in May-June 2007, which took place at a slightly earlier point in the overall move – the final leg of the rally went further and lasted a bit longer than in the Nasdaq. Other than that, the advance looks almost like a spitting image of the Nasdaq blow-off eight years earlier:

Generally the SSEC tends to produce patterns that are slightly different from those observed in other, much longer established stock markets. This is probably due to the much stronger and more direct influence China’s government exerts on the Shanghai stock market (this influence has begun to wane though, as the difficulties the government experienced in trying to get control of the 2015 decline illustrated. Ultimately, markets cannot be “controlled”). Once the desired trend has been set into motion though and speculators begin to herd, pattern self-similarity reasserts itself – click to enlarge.
Note that the shape of the correction interrupting a blow-off move is not always exactly the same. For example, the Nikkei had only two small down months in June and August of 1989, interrupted by a strong advance in July. In principle this was also an A-B-C shaped correction, but if had an upward skew, it was a “running correction” that almost doesn’t feel like a corrective pattern while it plays out.
The DJIA in the 1920s exhibited a few peculiarities as well. There was a strong, but volatile rally in the DJIA during the Gilded Age between 1861 and 1906. Then the market started to go sideways, fluctuating in a wide range between roughly 55 and 100 points for 20 years. When the 100 level was finally decisively breached in 1925, an accelerating rally began.
The blow-off stage arguably started in 1928, when the move became near vertical. There was a sharp one month pullback in late 1928, but the market immediately ran to a new high in early 1929. Then it suffered an a-b-c-d-e shaped correction between February and May prior to the final leg up. A similar a-b-c-d-e correction happened in the DJIA in 1986 and on a smaller scale again shortly before the peak in 1987, as part of the famous “three peaks and a domed house” formation .

The market took off in 1925 after finally breaching long-term resistance at the 100 level (there were two prior attempts at a breakthrough in 1916 and late 1919 which failed). Until 1928 it seemed a strong, but by and large normal bull market. Then a near-vertical blow-off like ascent began, which was interrupted by two corrections in close succession in late 1928 and late 1929 – click to enlarge.
Even if the corrections during blow-off stages are not always similar, the fact remains that there is usually at least one noticeable correction interrupting the final rally. In other words, if the market were to correct in the near future, it would probably not be the end of the advance just yet. The fact that fairly strong pattern self-similarity can be observed on these occasions throughout history is obviously not a guarantee that things will play out in the same way again, but historical patterns are the only yardsticks we have.
It is fairly unusual for bull markets in stocks to end in blow-off moves. Spike tops are normally associated with commodities, while stock market rallies are more likely to end in somewhat drawn-out distribution patterns. Conversely, declines in stocks often end with spike lows, while commodities usually bottom out in drawn-out accumulation patterns.
The reason for these differences are the emotions driving these trends. Both rallies in commodities and declines in stocks are predominantly driven by fear. Fear produces spike moves, because it is a very strong emotion, but it also tends to be relatively short-lived.
Escaping its grip is hard – when palladium prices peaked in 2001, a US car manufacturer reportedly spent $2 billion to acquire a large inventory of the metal, paying $1,600 per ounce, or $500 more than the highest price ever attained in the futures market (which at the time sported a margin requirement of 100%). Fear of a supply shortage won the day.
Stock market declines end with brokers receiving “just get me out” calls and margin clerks racking up overtime. Spike tops in stocks are rare, because the predominant emotion in stock market rallies is greed, which is powerful but not as intense as fear.
Longer Term Patterns
The market’s recent behavior – beginning in 2015 – is in many ways reminiscent of the 1998 – 2000 period. Naturally there are a great many differences as well, as every historical period is unique. Still, there are a few noteworthy parallels:
An emerging market scare, featuring plunging EM currencies and stocks (Asian/ Russian crisis of 1997 to 1998, vs. 2014-2015 growing EM worries amid falling commodity prices); the scare provokes renewed central bank largesse (with the Fed postponing its rate hike plans by a year, and ECB and BoJ opening their spigots even wider – later joined by the BoE upon Brexit); the scare also brings about a hefty market stock correction, but the predictable central bank response encourages speculation to resume.
As the market rebounds from its lows, a US presidential election brings a Republican candidate to power who replaces a Democrat; the dissipation of the stock market scare leads to the Fed resuming its tightening program. Stock market participants are oblivious to any potential dangers and the bullish consensus soars along with stock prices. Note that at the end of February 2017, the weekly percentage of bulls in the Investor Intelligence survey reached its highest level in 30 years – i.e., since 1987, a year that should ring a bell.
Interestingly, there are also parallels visible in the longer term chart patterns, i.e. the pattern in the ~18 months before the start of the blow-off rally. Even the Nikkei’s chart pattern preceding the 1989 blow-off is eerily similar. Here are the main features of this pattern – the first example shows the Nasdaq from 1998 to 2000:
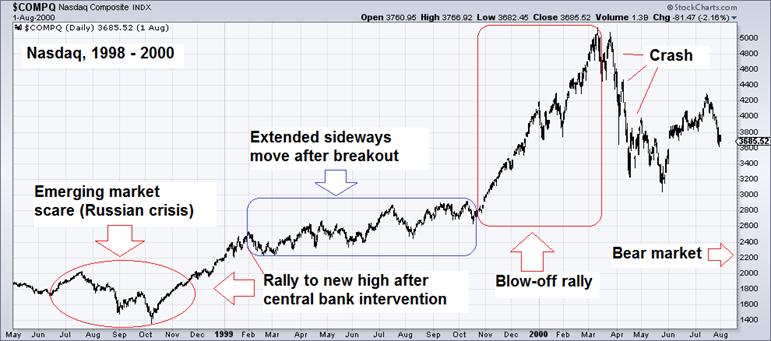
The complete pattern – the scare, the move to a new high in the wake of monetary pumping, an extended sideways move after the break-out, and then the blow-off. During the latter two stages the a tightening campaign by the central bank is underway – click to enlarge.
We didn’t mention above that blow-offs often tend to end in crashes. Note that not every crash is followed by a longer term bear market – sometimes the crash is the bear market. More on this further below, for now we just want to focus on the great deal of self-similarity in price behavior in the period leading up to blow-off phases, which serves as an additional identification marker. Here is the DJIA since 2015:

Here we go again: the scare that produces a big correction which leads to more central bank largesse – and is followed by a move to a new high. An extended sideways move… and then the blow-off rally – click to enlarge.
The next chart shows how the pattern played out in the Nikkei from 1987 to 1990 – in this case the scare emanated from the infamous 1987 crash on Wall Street, but once again the response by central banks helped what was at the time the strongest market to quickly move back to new highs and end its advance in a glorious blow-off followed by a quite memorable flame-out.

The Nikkei’s pattern from 1987 to 1990 was once again very similar. While the scare had a different source, there was a similar response by central banks, with the BoJ the first central bank to resume tightening (which is reminiscent of the Fed today) – click to enlarge.
The stock market’s pattern leading up to the 1987 crash – a rare crash from a record high that didn’t lead to a bear market (we can think of a variety of reasons for this, but we want to restrict our focus on the pattern similarities here) – was very similar, only the individual phases took approximately two to four times as long. Insofar it was more akin to the market action in the 1920s following the early 1925 breakout of the DJIA over the 100 level (in the 1980s the equivalent breakout level in the DJIA was at 1000 points).

DJIA 1980 to 1987 – the same pattern, but stretched by a factor of two to four, depending on the phase. We have marked the a-b-c-d-e correction in the middle of the blow-off stage, which was another parallel to the late 1920s pattern. Note that once again, the blow-off was actually accompanied by the Fed tightening – Volcker had lowered rates beginning in 1982, but his successor Greenspan immediately embarked on a tightening campaign which lasted until shortly before the crash – click to enlarge.
How Blow-Offs End
Blow-off moves are frequently followed by a crash. Often no “fundamental” explanation for such an event is available, even if a variety of contributing factors can be pinpointed both ahead of it and retrospectively. Experience suggests that strong blow-off moves greatly increase the probability of an eventual crash, regardless of whether it is followed by a bear market and a recession or not.
All that seems to be required for the panic as such is a sudden loss of faith. There is usually a trigger, but it is often a relatively minor development that would have received little attention while the uptrend was intact. Crashes are of course rare, but so are blow-off spikes in stocks. Once again, from a fundamental perspective the expansion of money and credit deserves to be blamed.
As long as stock prices rise, investors keep borrowing money to increase their exposure. This demand for margin loans also contributes to upward pressure on the cost of credit, similar to stock buybacks, but this only becomes noticeable when no sufficiently offsetting credit expansion occurs anymore (of course, if a sharp rise in price inflation commences, the nominal cost of credit will rise as well and bonds will be crushed, but not necessarily the real cost).
At some point exhaustion is reached – namely once the additional increments of money the market requires to keep rising exceed the amount provided by the combination of money supply growth and the percentage of their cash balances investors are prepared to allocate to stocks. Presumably because blow-off moves occur at the tail end of long-lasting bull markets and exert a strong psychological pull as discussed in Part 1, margin debt expands especially strongly. This in turn partly explains why crash probabilities are elevated once a blow-off concludes.

Growth in margin debt has recently resumed with gusto lately. It is unusual to see it getting a “second wind” after a sharp initial decline from a new record high – click to enlarge.
Once the trend does reverse, the second characteristic feature of a blow-off will usually evaporate in an instant as well. A critical mass of investors will suddenly stop believing the “story” that was used to rationalize buying egregiously overvalued stocks. This provides the psychological impetus for a crash.
Below is an illustrative example from another market, namely the oil market. We picked it because one of the stories underpinning its blow-off in 2008 is so easily identifiable. The number of web searches for “peak oil” topped out almost concurrently with oil peaking at $150 in mid 2008. As soon as oil prices started to decline, people no longer wanted to hear about peak oil. Many books on the topic that had been freshly published at the time went directly into the remainder bin.

Web searches for “peak oil” – the Malthusian notion that the world is on the verge of running out of oil always becomes popular in times of rising oil prices as a means to rationalize price extremes. Once prices begin to fall, interest in the idea tends to evaporate quite quickly – click to enlarge.
There exist similar studies of the number of times the term “new era” was mentioned in newspapers in late 1999/ early 2000. By experimenting with various search terms on the Google trends page one can find numerous similar examples.
Conclusion
To summarize: the lagged effects of previous money supply growth excesses are still playing out, just as money supply and credit expansion seems to be coming under pressure. This is combined with a fantasy that is so unlikely, people apparently just cannot bring themselves to doubt its veracity – after all, why would anyone tell such a preposterous story if it were not true? :)
Seriously, we do think Donald Trump is overall likely to be better for the economy than his opponent would have been, but his State of the Union speech was at best a mixed bag. It remains to be seen where the focus in terms of implementation will be, as all the really important moves have yet to happen. However, this is actually irrelevant to the topic at hand.
The only criterion that counts with respect to the market’s longer term return prospects are valuations, while its the ebb and flow are largely driven by money supply growth and monetary policy (notwithstanding the fact that monetary policy cannot possibly “bail out” the market every time; in particular, once risk aversion sets in, there is nothing the central bank can do to stop its effects from playing out).

The Long and the Short of it – a ticker tape cartoon by Russell Patterson published by Life in 1930
Valuations and chart patterns suggest the market has embarked on a blow-off rally. What will eventually capsize the boat is a sufficiently pronounced slowdown in money supply growth. We believe a continuation of the recent slowdown has become very likely. As noted in Part 1, the critical threshold is by its nature a moving target though, and can at best be guessed at.
Lastly, while we cannot say how far the move will go, we can make one prediction with considerable confidence: once the market’s trend has reversed, the financial media will often “explain” declines in stock prices with the same reasons they previously used to explain why they went up. That happened e.g. in the case of Japan’s infamous bubble. As long as prices rose, the Keiretsu system was hailed as a major reason why they could not possibly decline. Once the decline began, the Keiretsu system was often named as a major factor exacerbating the bear market and standing in the way of recovery.
Addendum and Bonus Chart
We penned an article focused on money supply growth just after its interim peak in November. The outstanding second part is still going to be posted, we just didn’t get around to it yet on account of time constraints. The delay has the advantage that we now have an opportunity to discuss the recent slowdown in money supply growth as well and spell out in more detail why we think it is likely to persist.
Here is a chart from the recent Elliott Wave Financial Forecast published by Elliott Wave International. It shows the weekly percentage of bulls in the Investors Intelligence survey we mentioned above and brings another interesting datum into context (namely the DJIA’s recent 12-day winning streak).

A 30 year high in the weekly percentage of bulls, and the first time 12 consecutive gains were recorded in 30 years as well (the internals of the move back then were a lot stronger though), via EWI, click to enlarge.
Abrazos,
PD1: Una persona que ríe a diario no es porque siempre le vaya bien, sino porque aprendió que debe sonreír siempre sin importar lo que pase. Y en Cuaresma, es la mejor mortificación, hacer feliz a la gente con tus sonrisas…