Es un problema de valoraciones. Que las bolsas occidentales sean capaces de seguir subiendo, es un tema de los altos precios alcanzados…
What’s Going On?
Why does it feel like every time stocks falls a little, they’re going to fall a lot? This is probably a permanent feature of the stock market, but it seems like that drum is beating very loud these days. I believe there are two main reasons why some investors have three feet out the door.
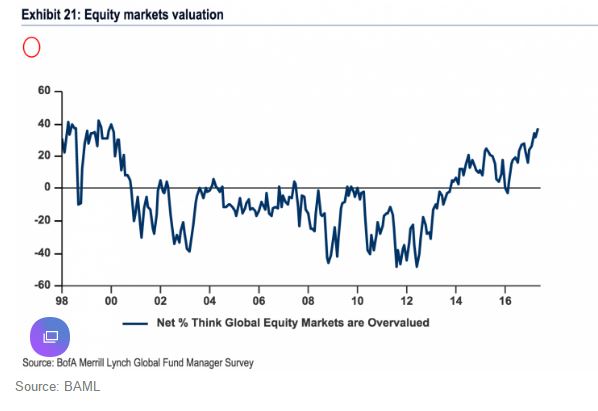
First, everybody knows stocks are overvalued. Or, said more accurately, everybody knows that stocks are trading at a higher multiple than they have historically. It’s hard to go a day without seeing an article referencing the CAPE ratio. The chart below from Bank of America Merill Lynch shows that 37% of fund managers they surveyed think stocks are overvalued, the highest reading since January 2000.

So stocks are expensive and people are waiting, nay, begging for them to come down. This, coupled with the fact they haven’t pulled back in so long has created a weird feedback loop where the lack of movement is making some investors paranoid. It “feels” like there is a rug-pull moment coming any day now.
A few interesting statistics on how calm the market has been; There has been just one -1% day in the S&P 500 in 2017 (Today could be the second). Up until this point in 2016, the S&P 500 fell 1% 17 times.
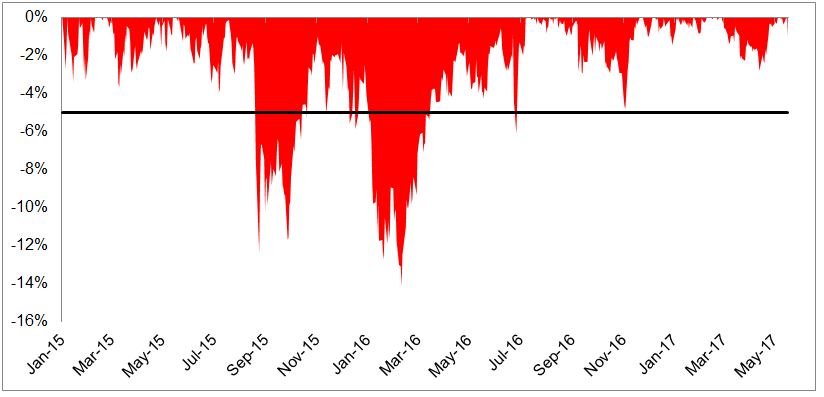
I was surprised to find that the S&P 500 hasn’t had a 5% pullback since July 2016.

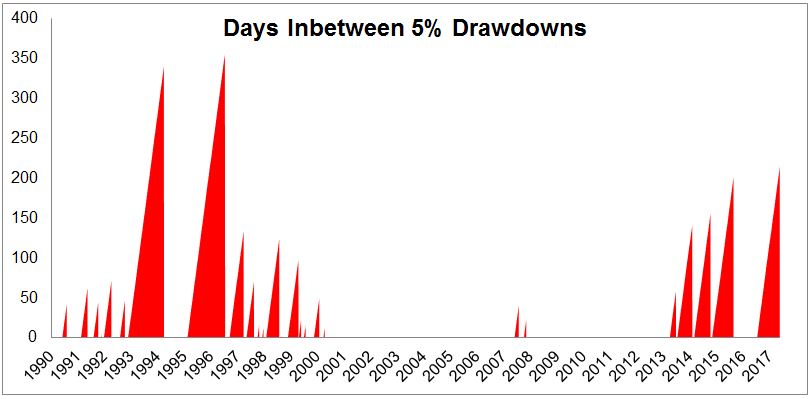
The chart below shows that the index gone 215 days without a 5% drawdown, which is the longest streak since 1996!

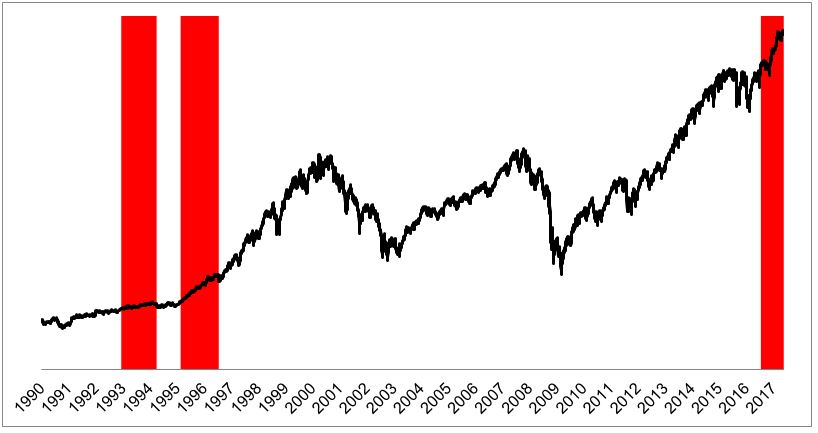
The chart below shows the two previous streaks that lasted at least as long as the current one. There was no rug pull in 1994 or 1996, both ended with drawdowns less than -10%. Obviously this provides us with us no information as to how this will play out, such is the nature of historical data.

Stocks are expensive yet they have refused to go down, and the noise coming out of Washington probably isn’t helping investor psychology. It’s difficult to stay invested these days, but isn’t it always.
Abrazos,
PD1: Siempre es igual en todas partes: se suele invertir más en donde se vive, ya que se cree que se controla más, o mejor dicho, se cree que se conoce mucho mejor… Y se pierden grandes oportunidades invirtiendo fuera. Conozco tal barbaridad de gente con carteras enormes en los bancos españoles que, sí fueron muy rentables en los años 90, pero desde el 2000 no se comen ni un colín…
It is a well-known fact that investors skew their equity exposures toward their home country – that is, they exhibit a home country bias. According to data from the IMF’s Coordinated Portfolio Investment Survey,1 US investors allocated over 70% of their equity assets to the US even though based on market capitalization the US represents less than 50% of the opportunity set. This by no means is a US-only phenomenon. Canadian and Australian investors exhibit similar levels of concentration of equity exposures (60%-70%) in their domestic markets despite these markets representing only 3.3% and 2.4% of the global opportunity set based on their respective weights in the MSCI ACWI index. The recent strong returns of US vs. non-US stocks is most certainly at the top of the list in explaining the strong preference many currently harbor for US equities.
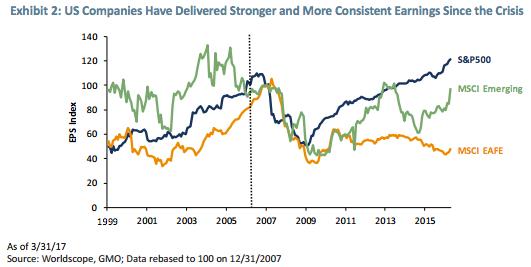
US and non-US stocks have traded leadership over many cycles and decades. The yellow portions of the graphs in Exhibit 1 indicate periods in which US stocks have outperformed their overseas developed brethren. In particular, as the far right side of the first graph suggests, both the magnitude and duration of the US outperformance over the last nine and a half years have reached extreme levels. The US and emerging equity markets have displayed similar leadership cycles, though over shorter periods of time and with even more dramatic relative performance cycles.


Certainly, a portion of the US outperformance is warranted. US equities did not need the recent election to make them “great.” While the economic recovery from the 2009 recession has been muted, US companies have delivered stronger and more consistent fundamental growth relative to developed and emerging companies, especially during the last few years. Policymakers in the US took aggressive steps during the GFC, helping the US economy and market to recover more quickly. One such step was to require banks to recapitalize their balance sheets (often through painful dilution and write-downs). The same could not be said outside the US. The Eurozone remains exposed to sovereign credit issues and more levered banks. In Japan, aggressive fiscal and monetary actions came eventually but failed to stimulate the slow-growing nation, which continues to face persistent demographic and other structural challenges. Emerging countries (and their currencies) initially benefited as China responded to the GFC aggressively through debt-supported infrastructure spending, but over the last few years emerging countries have seen their expensive currencies reprice and have had to adjust for slower growth in China and its subsequent adverse impact on commodities prices.
Exhibit 2 indicates the strength and steadiness of the earnings recovery in the US vs. EAFE and emerging markets. US earnings stand 21% higher than at the beginning of 2008, while EAFE earnings have been cut in half and emerging earnings are flirting with being flat.

In response, investors drove equity prices significantly higher in the US than outside the US. From the end of February 2009 through March of this year, the S&P 500 has returned an impressive 18.0% per year, while the MSCI EAFE and MSCI Emerging Market indexes have delivered 10.8% and 11.2% per annum, respectively. On a cumulative basis over this 8-year period, US stocks rose about 170% more than nonUS equities. That is 1.7x more wealth to sit comfortably within the confines of the United States! It is no wonder that many investors have been reluctant to shift equity exposures away from the US. We would argue this is a classic case of recency bias: Investors are extrapolating the excellent returns US stocks have provided of late far into the future. While most assets appear expensive after many years of strong gains, US equity valuations currently stand far higher than non-US valuations.
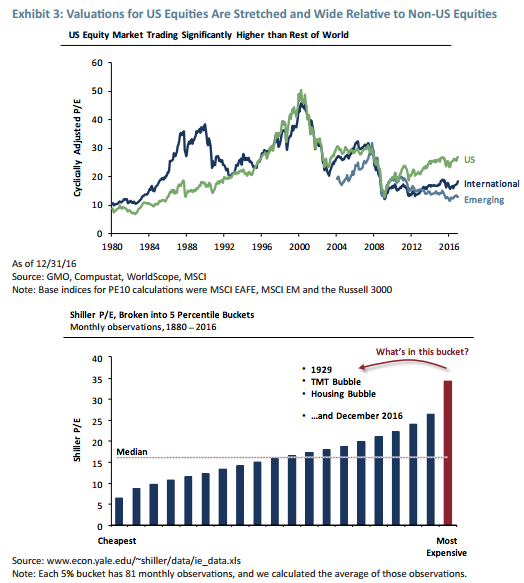
Using Shiller’s cyclically adjusted P/E (CAPE) ratio, one of many valuation measures, Exhibit 3 illustrates both the expensiveness of US stocks and the relative attractiveness of developed and emerging equities. A yawning gap has opened up in the relative multiples for these various geographic exposures. Today’s CAPE of 29x for US equities does not look too stretched in this exhibit. The second chart below, however, puts the expensiveness of the US markets into broader perspective. The market is trading in the most expensive ventile in history! The only other times US equities have been this expensive on this measure include 1929, the peak of the Internet bubble, and in 2008, just before the GFC. For those inclined to dismiss CAPE, other valuation metrics such as the Price/Sales ratio have soared to dizzying heights as well.

Investors have clearly rewarded US companies for their higher earnings growth by paying significantly higher prices for them. Perhaps, though, the market has gotten ahead of itself. Equities are long-duration assets – investors are not just buying stocks for the next few years of earnings, they are buying an earnings stream stretching out for decades. In competitive economies and markets, both valuations (price multiples) and profit margins (return on capital) tend to mean revert. Our founder and Chief Strategist Jeremy Grantham, however, points out a number of reasons why US profit margins may stay elevated and take longer than prior periods to mean revert (see “This Time Seems Very, Very Different,” Jeremy Grantham, 1Q 2017). While valuation has been a great predictor of return, it unfortunately does not tell us much about the timing in which assets will mean revert to fair or normal levels. We still believe, though, that the price you pay for an asset is the biggest determinant of the return you will make. The more you pay, the less you will make.
Rather than buy the comfortable asset, investors should ask, “What’s in the price?” We would argue that the relatively good news in the US is more than reflected in asset prices. Emerging and developed ex-US stocks look to be more attractively priced (even accounting for higher fundamental risks). In fairness, nothing looks cheap. The best we can say is that value stocks in emerging markets look to be near fair value and that the spread between expected returns for emerging market value and US stocks is quite wide. In addition, emerging markets offer modestly attractive currencies. We believe long-term investors able to ride out the invariable market swings should fight their home country bias and buy emerging.
1 International Monetary Fund, “Coordinated Portfolio Investment Survey,” June 2016.
PD2: San Agustín decía que había que pedir siempre con perseverancia. Pedimos mal y se nos concede lo que necesitamos. Yo creo que a Dios le gusta que le pidamos cosas espirituales, no materiales.
El ideal es convertir el día entero a Dios: es lo que se llama la oración continua. Ofrecer todo lo que hacemos a Dios, todo lo ordinario, el trabajo profesional y el de casa, los afectos, la caridad con los demás, el apostolado. Si así lo hacemos, si ofrecemos todos nuestros quehaceres, estaremos rezando todo el día, pidiendo, dando gracias, alabándole…