El mercado está descontando un escenario muy extremo. Espera demasiado de Trump y puede ser decepcionado…
Danger Lurks As Extremes Become The Norm 01-13-17
Extremes Become The Norm
There have been a litany of articles written recently discussing how the stock market is set for a continued bull rally. While Trump was initially expected to be extremely bad for the market, post-election he somehow became extremely good for it. The are some primary points in common among each of these articles which are: 1) interest rates are low, 2) corporate profitability is improving, 3) oil prices are rising, and; 4) Trump’s fiscal policies will supplant the Fed’s monetary policies.
While the promise of a continued bull market is very enticing it is important to remember, as investors, that we have only one job: “Buy Low/Sell High.” It is a simple rule that is, more often than not, forgotten as “greed” replaces “logic.” It is also the simple emotion of greed which fosters exuberance and extremes which ultimately reverts into devastating losses.
Therefore, if your portfolio, and ultimately your retirement, is dependent upon the thesis of a continued bull market you should at least consider the following charts which are a collection of current “extremes” in the market.
Extreme Valuations
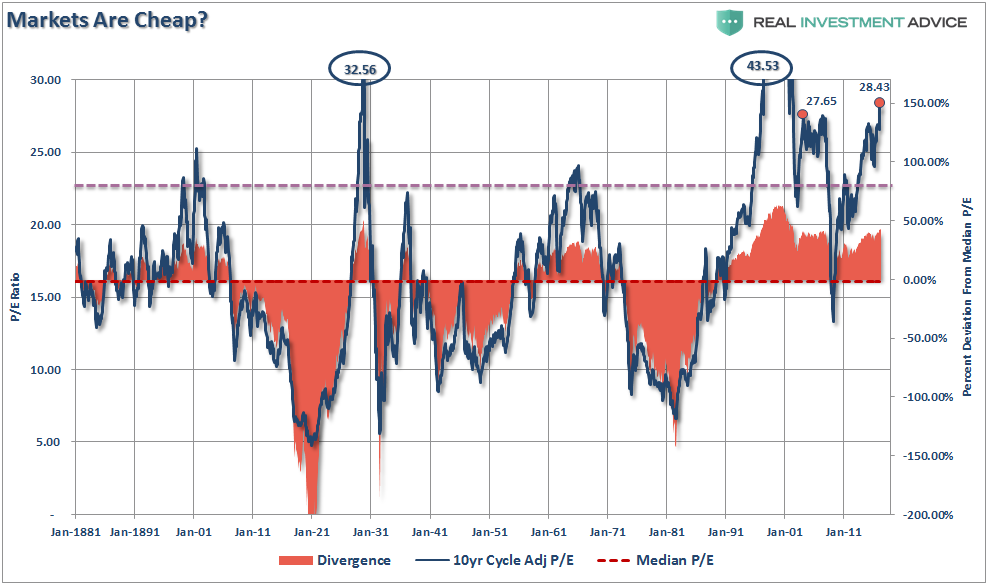
It is often stated that valuations are still cheap. The chart below shows Dr. Robert Shiller’s cyclically adjusted P/E ratio. The shaded area is the current deviation of P/E’s above or below their long-term median P/E.

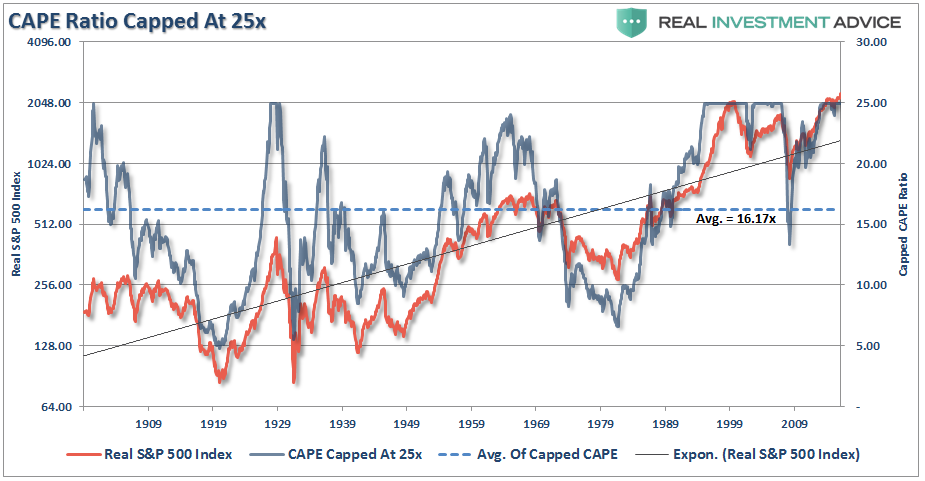
Currently, valuations are pushing levels only witnessed in 1928-1929 and 2000. However, it is often suggested the current valuations are nowhere near the “dot.com” level so obviously stocks are just mildly overpriced. The problem is current valuations only appear cheap when compared to the peak in 2000. In order to put valuations into perspective, I have capped P/E’s at 25x trailing earnings as this has been the level where secular bull markets have previously ended. I have noted the peak valuations in periods that have exceeded that level.

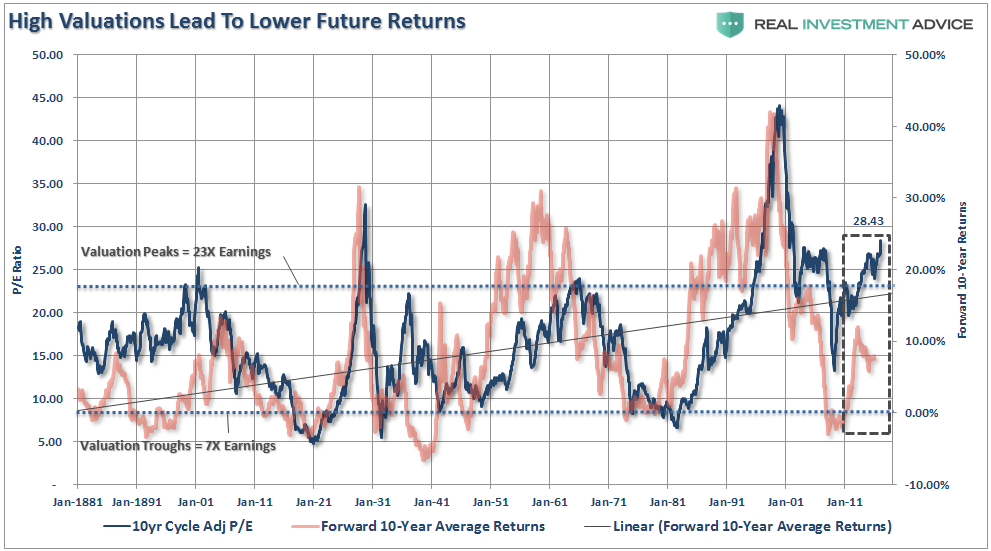
With valuations at levels that have historically been coincident with the end, rather than the beginning, of bull markets, the expectation of future returns should be adjusted lower. This expectation is supported in the chart below which compares valuations to forward 10-year market returns.

The function of math is pretty simple – the more you pay, the less you get.
Extreme Prices
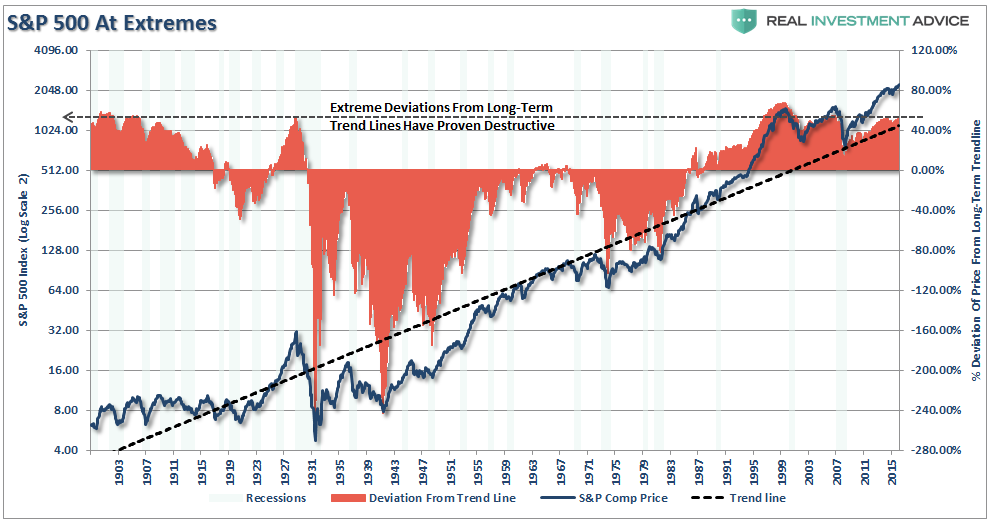
I have often compared market prices to the equivalent of “stretching a rubber band.” Prices can only deviate so far from the long-term trend line before a mean reverting event eventually takes place. Much like a “rubber band,” prices can only be stretched so far before having to be relaxed to provide the ability to be stretched again.
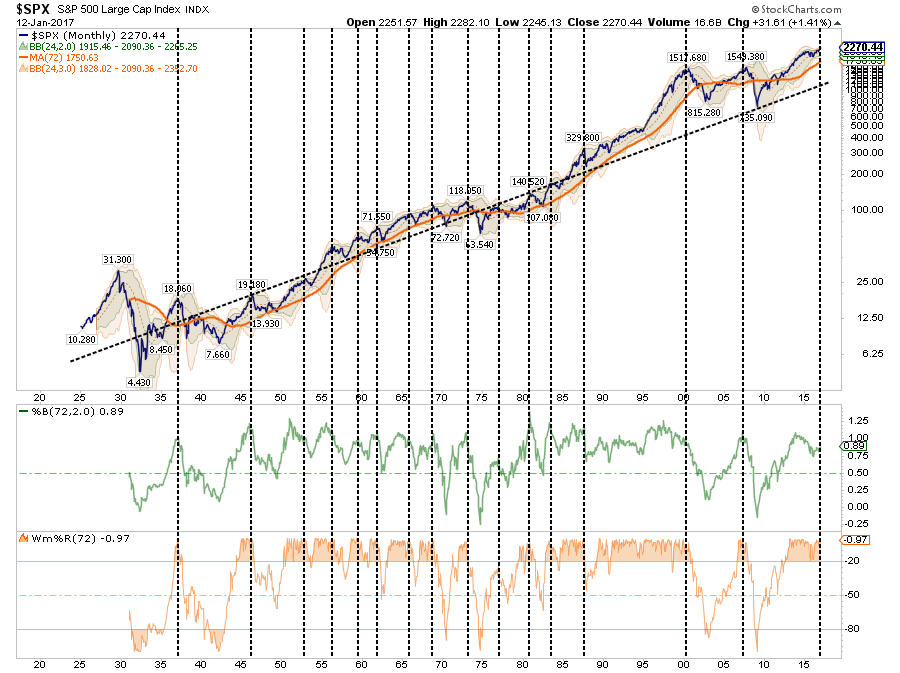
The chart below shows the long-term trend in prices has compared to its underlying growth trend. The vertical dashed lines show the points where extreme overbought, extended conditions combined with extreme deviations in prices led to a mean-reverting event.

This is shown a bit clearer below which compares the deviation of the S&P 500 from the long-term growth trend. Currently, while only slightly below the peak of the 2000 “dot.com” bubble, the deviation is at levels that have ALWAYS coincided with a negative mean reverting event or very poor, and highly volatile, forward returns.

Extreme Allocations
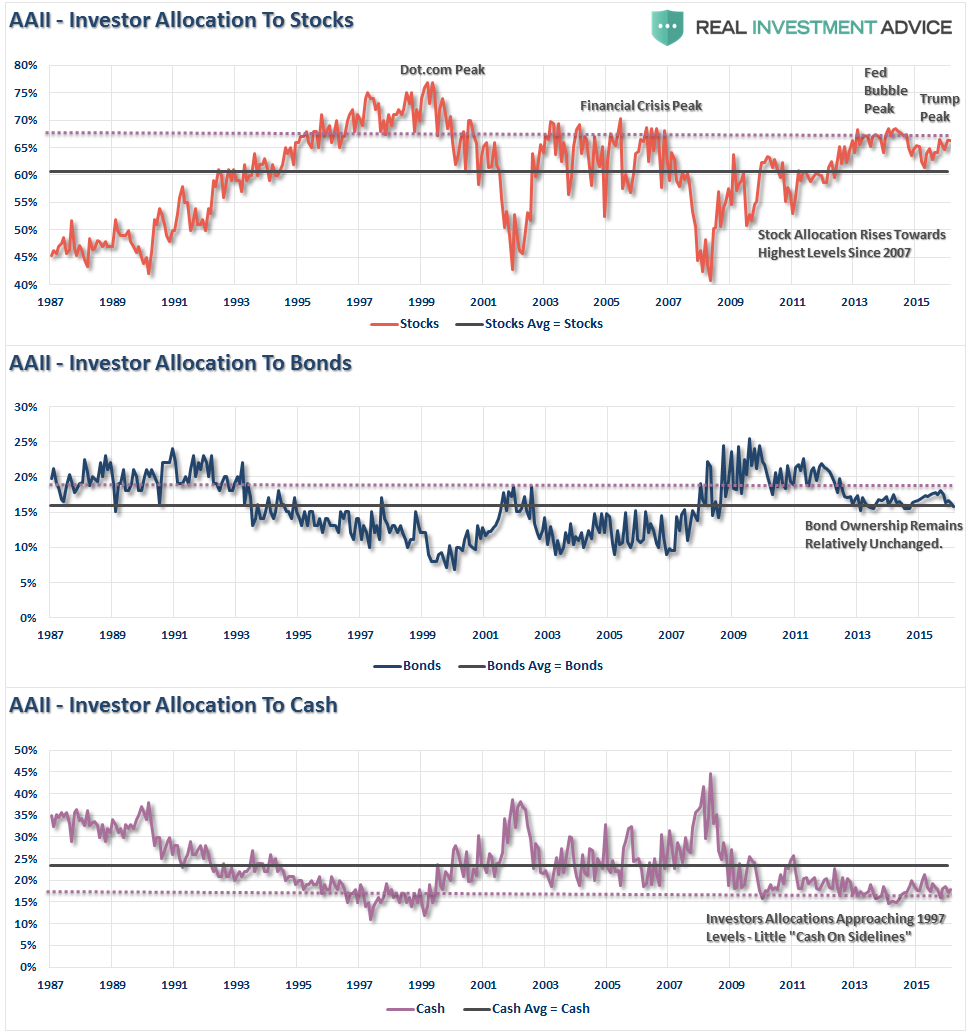
Another argument I hear made consistently is that retail investors are only just now beginning to jump into the market. The chart below shows the percentage of stocks, bonds and cash owned by individual investors according to the American Association of Individual Investor’s survey. As you can see, equity ownership and near record low levels of cash suggest that the individual investor is already likely “all in.”

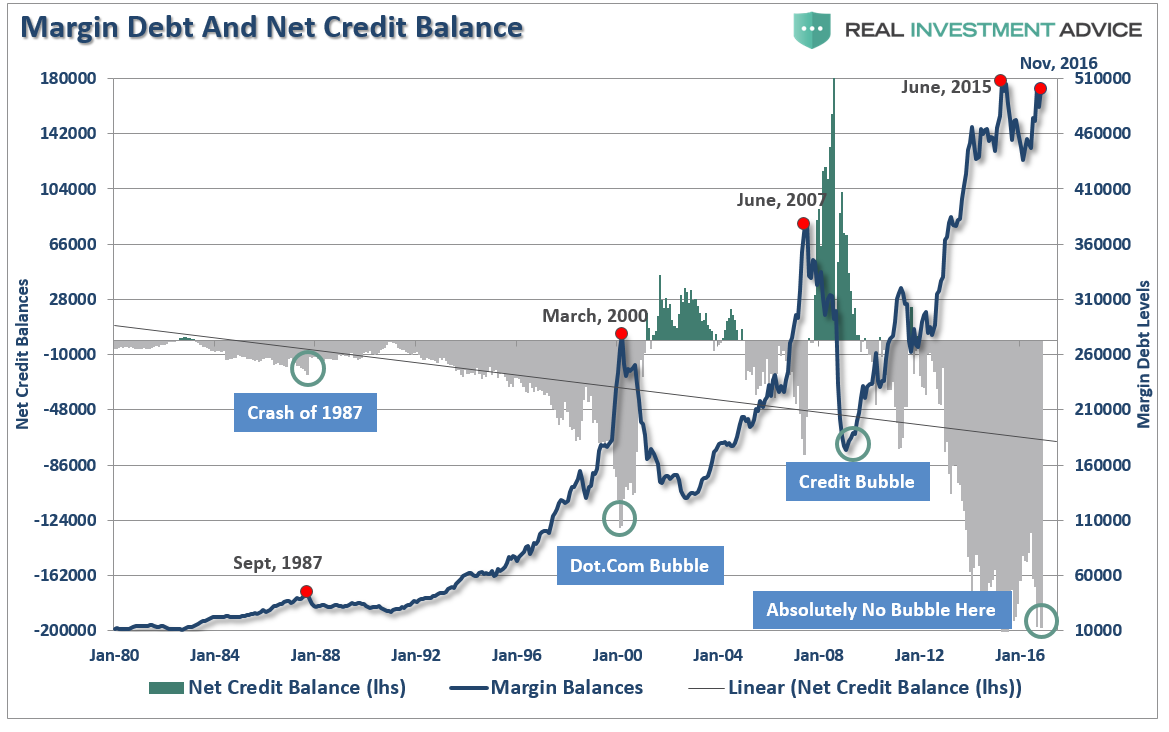
Extreme Leverage
Of course, with investors fully committed to stocks it is not surprising to see margin debt at record levels as well as investors leverage up to chase returns.

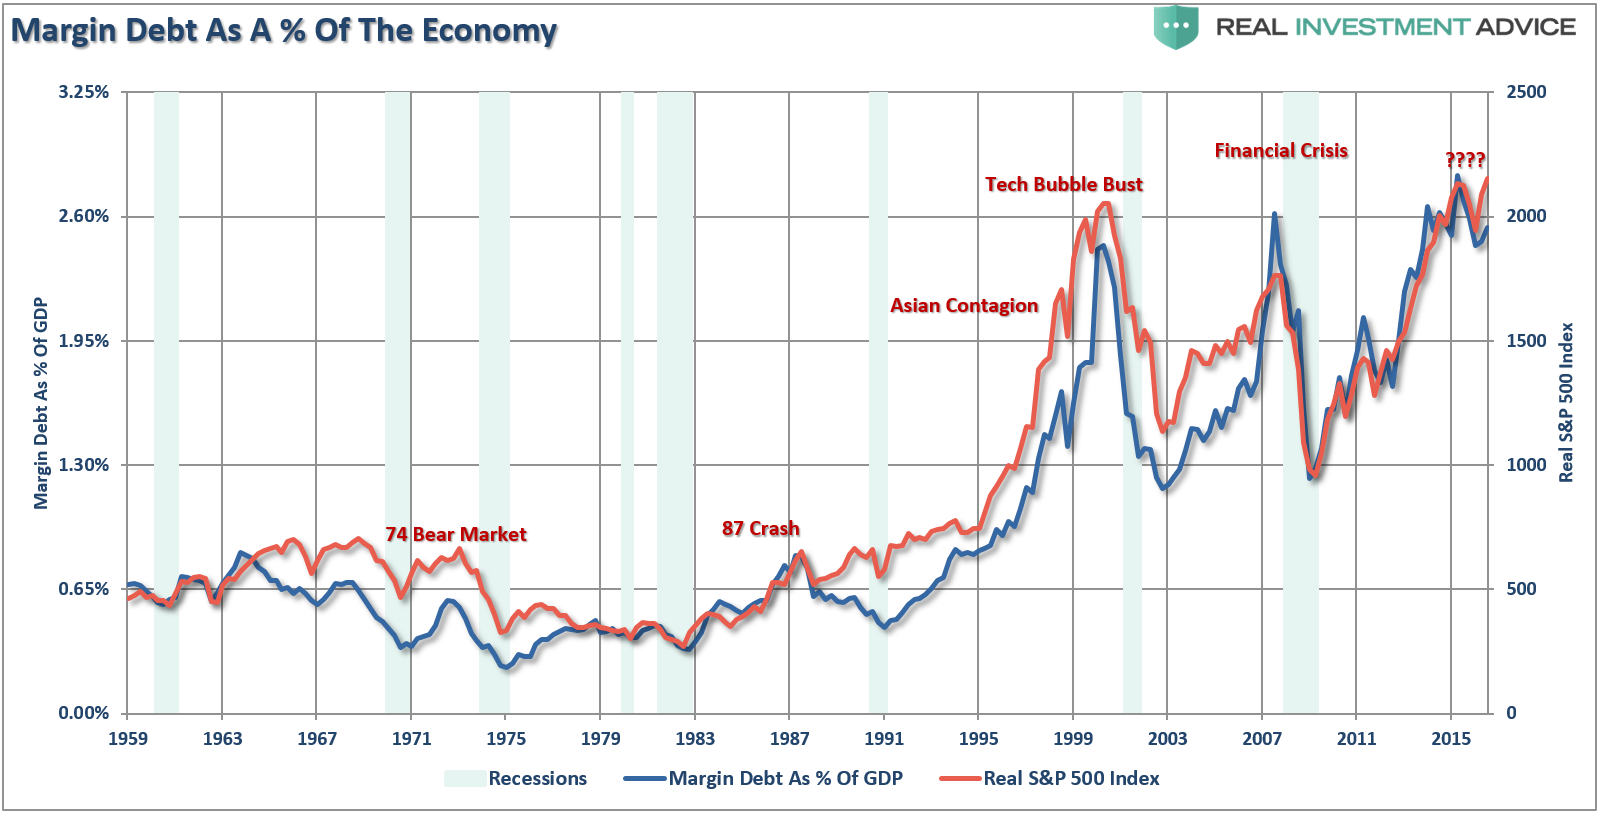
When we look at the levels of Margin Debt/GDP ratio as compared to the S&P 500, we find a high correlation between peak levels of debt and subsequent market returns. Not surprisingly, extreme levels have been more indicative of “ends” rather than “beginnings.”

Extreme Positioning
As detailed recently by ZeroHedge, according to DB’s calculations, the net short Treasury position is now a four sigma event, having grown to nearly four standard deviations away from mean, even after adjusting for open interest.

VIX futures are near record shorts along with speculative net shorts in Eurodollars which also increased to a new record high of 2,442K (+326K) contracts.

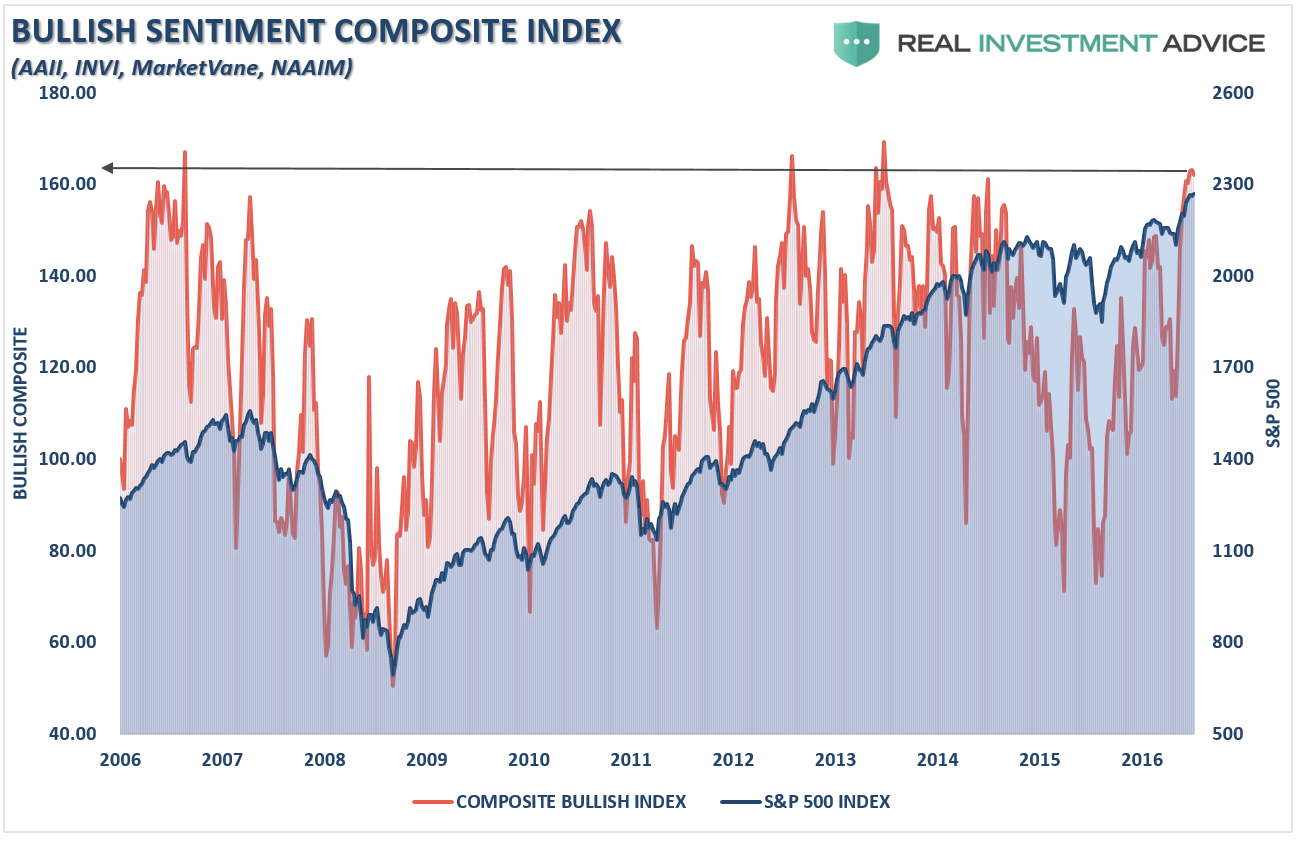
Extreme Sentiment
Bob Farrell’s rule #9 states that when everyone agrees; something else is bound to happen. The next two charts show the level of “bullishness” of both individual investors (AAII Survey) and professional money managers (MarketVane, NAAIM & INVI Surveys). Surprisingly, investors are currently more exuberant than just about at any other time on record.

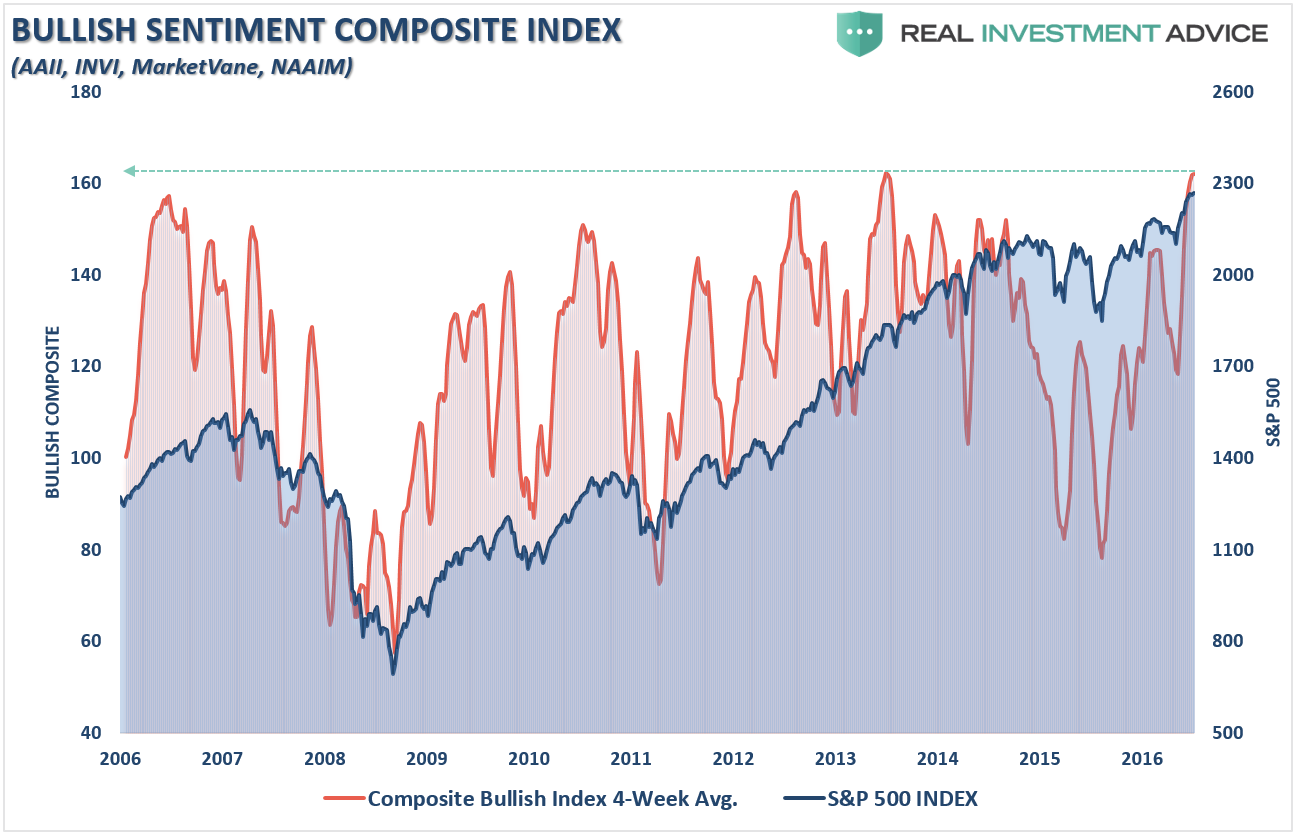
If we smooth the index with a 4-week average we get a better view of the current level of exuberance. Importantly, such levels of exuberance have been historically, once again, associated with short to intermediate-term, or worse, corrections.

When extremes become the norm, and are readily accepted as such, it has historically been associated with market bubbles.
1929 – Stock reach a permanently high plateau
2000 – This time is different
2007 – It’s a Goldilocks Economy
While I am not suggesting the markets are about to crash tomorrow, I am suggesting that future returns are likely to be much lower than currently estimated by the majority of the financial media.
“But Lance, since you are all ‘bearish and $#(%,’ you are all in cash and missed out on the markets advance.”
That would be incorrect.
As a money manager, I am currently long the stock market. I must be, or I potentially suffer career risk. However, my job as a portfolio manager is not only to make money for my clients, but also to preserve their gains, and investment capital, as much as possible. Understanding the bullish arguments is surely important, but the risk to investors is not a continued rise but rather the eventual reversion that will occur.
Unfortunately, since most individuals only consider the “bull case,” as it creates confirmation bias for their “greed” emotion, they never see the “train coming.”
Currently, with everyone on the “same side of the trade,” any exogenous event which triggers a movement in the opposite direction tends to result in a stampede. Hopefully, these charts will give you some food for thought.
Remember, every professional poker player knows how to spot a “pigeon at the table.”
Make sure it isn’t you.
This Is Interesting
I want to repeat this little blurb from Tuesday, only because it ties into last weekend’s newsletter as well.
“In ‘The Problem With Forecasts,‘ I noted the Dow is currently working on completing an advance of 5000 points over a 24-month span. The last time such a compressed advance occurred was during the 1998-1999 period.
But what about the S&P 500?”

“Following the 1994 market lull, the S&P 500 began its first serious bull market advance as a wave of investors flooded into the market due to the introduction of online trading and the official opening of the “Wall Street Casino.” From 1995 to its peak in March of 2000 the market advance (whole number basis only) by 1000 points over that 60-month period.
Of course, the subsequent correction of the “dot.com” mania reset the market by roughly 50% of that previous advance.
Following the crash, investors reluctantly began to return to the markets in mid-2003. As the Federal Reserve, and deregulation of Wall Street advanced, so did investors speculation in the markets as a real estate sub-prime lending took hold. Beginning in 2003, the market began a 60-month trek higher of 700-points before once again finding the limits of “fantasy and reality.”
So, here we are once again. Over the last 60-months the markets have advanced by 1100-points, and 1400-points over the last 84 months, as Fed-induced monetary stimulus and suppression of interest rates have once again led investors to believe “this time is different.”
Throughout history, as shown in the chart below, prices have ALWAYS, and I repeat ALWAYS, eventually found their limits. There has never been a “permanently high plateau” that inoculated investors from devastating consequences of misconceived and poorly managed investments.”
As I noted above, when “extremes become the norm” that is the point in time where “danger lurks.”
Abrazos,
PD1: No soy de demostrar sentimientos, pero estoy lleno de ellos. Sufro en silencio, amo con miradas y hablo por sonrisas…