Yo creo que no lo va a haber, que quizás recorte esto algo más, si es que las FANG optan por realizar, algo dudoso… Con el paso del tiempo, vemos que los correctivos fuertes quedan difuminados:
Recovery Rallies: Are 2 Years, 6 Years, or even 9 Years Enough?
Soon after the market bottom of March 2009, we stated that the sharp week-long market drop in October 2008 resembled the market “crash” of October 1987. We then began showing graphs comparing market advances following those severe drops. In 2009 and again in 2010 we stated that it would be very reasonable for the recovery from the 2008 crash to resemble, or follow a path similar to, the recovery from the 1987 crash. The latest two updates, which proved quite accurate, were released in June 2015 and April 2017. As it approaches nine years, it appears to us, this current recovery is right on track and has the potential to continue a few more years. Here is an updated version of the report we issued in 2015 and 2017, with time related edits.
Craig Callahan, DBA
The stock market advance that began early March 2009 is approaching the nine year mark. It seems like almost daily some analyst being interviewed on TV or in print proposes that the end of the advance is near. When we listen closely, we do not hear any specific reasons given. Occasionally an analyst will offer statistics such as the average length of previous bull markets, but overall we sense that their reason is simply intuition that nine years feels long enough. But is it?
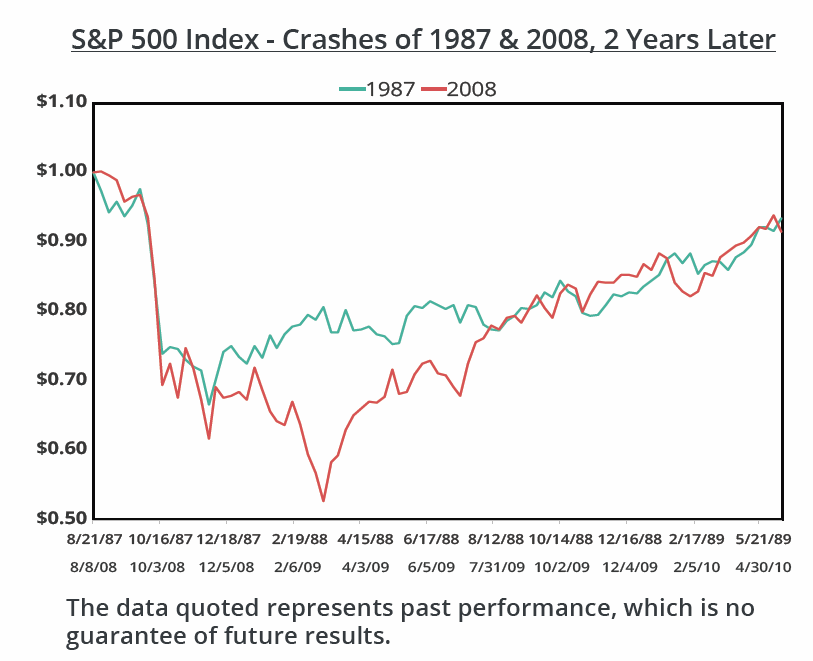
As you may recall, the end of the previous bear market and the transition to the current bull market featured a severe drop one week in early October 2008. As the drop spanned six trading days, it was not labeled a “crash.” When graphed using weekly data, that drop appears similar to the crash of October 1987. The graph below shows the S&P 500 Index (using weekly data) set equal to $1.00 on both August 21, 1987 and August 8, 2008. One of the major differences between the two recoveries is that during the early stages of the 2008 recovery the market was battling a recession and traded lower for a couple of months in 2009 before reaching its bottom. Conversely in 1987 the market was not facing a recession despite many inaccurate predictions of one. Ultimately in 2009 the market rebounded by mid-March and continued on a path similar to the recovery of 1987.

We first showed this graph to audiences in early 2009, suggesting that the market could experience a multi-year post-crash recovery as it had in the late 1980s and early 1990s. On September 18, 2009 we released an article, Was that a Crash?, with a similar graph and stated, “As of September 4, 2009, the ICON valuation readings suggest the market, in general, is priced about 13% below our estimate of intrinsic value. We believe such a reading makes an upward recovery path similar to 1988 and 1989 possible and reasonable.” On April 22, 2010, in a follow up article, Back to the Future, we showed an updated version of the same data and concluded, “[I]n retrospect it seems 1987’s post-crash behavior and recovery is indicative of the recovery we are seeing today. ICON continues to see value in the market and believes that those who remain invested may be able to capture opportunities in the months ahead.”

The graph above shows the same data as the previous graph, updated through almost nine years after each crash. Looking at the graph we see that on several occasions the Index reached the same value at the same elapsed time since the respective big drops, making the two post-crash recoveries appear quite similar. Lately in February of 2018, the recent recovery is lagging the recovery from 1987. We think it is important to note that both recoveries have also featured “volatility events,” where the market drops in response to an event but then recovers quickly and resumes its advance.
Examples of these volatility events are the European debt crises in 2010 and 2011 and the invasion of Kuwait in 1990.
Can a bull market recovery from a crash last longer than nine years? The graph below shows that the recovery from the crash of 1987 continued to the market peak of March 2000, a thirteen year run. This graph also illustrates a second volatility event in 1998, which the media labeled the “Asian Contagion” amid fears that the recession in Asia would spread to Europe and then the U.S.

What were conditions like in the mid and late 1990s while the stock market continued its upward march? The U.S. Dollar strengthened, the price of oil was fairly stable, interest rates were declining until late 1998 and 1999, corporate earnings were growing, inflation was low and P/E multiples rose. All else being equal, the P/E ratio* on the S&P 500 Index can be seen as a proxy for investors’ optimism for earnings growth. The more growth investors expect in earnings, the higher multiple they will pay. The last graph below shows the P/E ratio for the S&P 500 from August 1987 through March 2000 and from August 2008 through February 2018. During both periods the P/E ratio generally increased as memories of the crashes became more distant, although the P/E path in the late 1980s and 1990s may have been more volatile. It also appears that the P/E multiple expansion in the late 1990s was a big contributor to the stock market’s advance. Can P/E ratios continue to increase this decade like they did in the late 1990s? Although expansion like we saw in the late 1990s would be simply a continuation of the gradual increase underway lately, we cannot predict investors’ behavior. We just know that one post-crash bull market lasted longer than nine years and conditions and behaviors change over time.

In conclusion, contrary to the bearish headlines, we at ICON believe that we are in the midst of a long-term recovery. With our valuation methodology as our guide, we do not see the overpricing often seen at market peaks. Furthermore, as we saw with the post 1987 market recovery, bull markets can last longer than 9 years. We believe there is still room for market growth in the current environment.
Abrazos,
PD1: Un test para ver tu estado emocional. Elige, sin mentirte, una de estas personas. Y no hagas trampas, no mires primero los resultados…
Un test hecho por un renombrado psicólogo revela cuál es su estado emocional
Pip Wilson, psicólogo de renombre internacional, creó un #Test para valorar el estado emocional de las personas. Al principio, él emprendió una serie de tests para identificar el estado emocional de tres niños de tres años de edad, que venían de su primer contacto con la escuela.
A partir de ahí, el psicólogo creó el test en el que los niños deberían elegir cual de las personas que están intentando escalar un árbol, y con ello, analizó el humor de ellas. El test también es válido y eficiente para adultos, por tanto, atrevámonos a realizarlo. Solo lleva dos minutos.

Resultado
1 – Si eliges las opciones 1, 3, 6 o 7
Todas las figuras con 1, 3, 6 o 7 están subiendo. Eso indica que eres ese tipo de persona que intenta superar obstáculos. Eres una persona valiente, sin duda alguna, esta es una de las mejores señales del test porque tu status es el de un luchador.
2 – Si eliges las opciones 2,11,12, 18 o 19
Eres una persona muy sociable y que te gusta ayudar a los demás. Eres amable y siempre das una mano amiga a los que están a tu lado. También eres una persona muy respetada y que normalmente no tiene problemas en pedir ayuda cuando necesitas.
3 – Si eliges la opción 4
El número cuatro explica el comportamento de una persona pacífica y feliz. Sus objetivos se resumen en dos palabras: viviendo la vida. No dependes de nadie ni de nada para ser feliz.
4 – Si eliges la opción 5
En esta opción puedes estar pasando por un periodo de exceso de trabajo,puedes estar quedándote sin energía y no consigues cambiar esa situación. Es preciso que dediques un momento para reflexionar si es necesario cambiar, o algo que motiva un poco para salir de ese tipo de depresión.
5 – Si eliges la opción 8
Quien elige este número son personas aisladas del resto y prefieren vivir en su mundo. Esas personas valoran su tiempo y su espacio y no sienten la necesidad de compartir sus experiencias. Eso impide que tengas concentración en el trabajo. Es importante un cambio, conocer nuevas personas y experimentar cosas nuevas, ¡te sorprenderás de lo divertido que puede ser!
6 – Si eliges la opción 9
Tu marca es diversión, todos te consideran como alguien muy alegre y lleno de vida. Eres el alma de cualquier fiesta y te gustan las aventuras, emociones fuertes y desafíos. ¡Valórate más y comparte el mayor regalo, que es tu vida!
7 – Si eliges las opciones 10 o 15
Tienes gran capacidad de adaptación y te conformas con más facilidad que los demás. Independientemente de lo que pase, consigues ser indiferente y estable, creando un ambiente confortable. Consigues ser feliz con poquísimas necesidades. Vives feliz con las sorpresas que la vida te trae.
8 – Si eliges las opciones 13 o 21
Te cuesta conversar con otras personas, eso hace que pases grandes períodos de aislamiento y depresión, tal vez necesites ayuda psicológica para superar barreras.
9 – Si eliges la opción 14
Puedes estar atravesando un período difícil solo, haciendo de tu estado una amenaza seria a tu propia vida. Es preciso que intentes buscar ayuda de tus amigos y tratamiento a través de un psicólogo profesional. No ignores la situación, porque posiblemente puedas empeorar con el paso del tiempo.
10 – Si eliges las opciones 16 o 17
O te sientes amada por el 17 o sientes que estas ayudando a conseguir los éxitos de un 16. Te sientes muy apegado a alguna persona y la considera indispensable.
11 – Si eliges el número 20
Eres gracias a tus esfuerzos, una de las personas más elevadas. Has alcanzado tu objetivo emocional y ahora eres una referencia para todos los que te siguen. Eres líder y ahora necesitas descubrir cómo sacar provecho de la situación. Aprovecha que tus pasos están en el auge de tus objetivos. Con eso, ciertamente te sentirás mucho mejor.
(via Revista Pazes. Fuente: Blasting News)