Será solo un enfriamiento, ¿o es algo más?
Recent data releases related to the Eurozone have been disappointing. This column argues that momentum from the long-delayed 2014-15 recovery is faltering because the Eurozone economy is affected, with a lag, by the US slowdown. The traditional, lagged relationship between the EZ and US business cycles – which disappeared in the aftermath of the Global Crisis – is now reasserting itself.
On Friday 12 February, the fourth quarter GDP numbers for the countries of the Eurozone were released. Germany and Italy disappointed – at 0.27% and 0.11% respectively, the quarterly growth out-turns were below consensus expectations of professional forecasters.
One question worth asking is whether the recent unexpected weak numbers for the Eurozone are a consequence of the US slowdown, in which case we should expect further weakening down the road.
Recent bad news from the Eurozone arrived after a disappointing 2015 in the US. Figure 1 shows the evolution of the forecast for 2015 GDP growth by Now-Casting (red line), from a survey of professional forecasters (Focus), and from several official forecasters. It shows that downward revisions of growth estimates have persisted since the beginning of 2015 – year-on-year GDP growth for 2015 was estimated at 3.65% in January 2015, while by the end of January 2016 estimates pointed to a rate of 2.3%.1
Figure 1. US GDP now-cast, 2015 (YoY%)
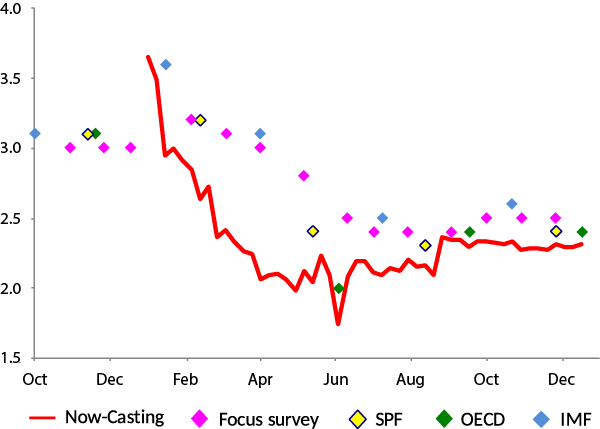
Source: Now-Casting Economics.
If we now focus on the first quarter of 2016 and compare the evolution of our estimates of quarterly GDP growth for the US (in red) and the Eurozone (in blue) (Figure 2), we can see that from November 2015 to January 2016, Now-Casting was revising down for the US and revising up for the Eurozone. Recently, however, things have changed for the Eurozone. In January, survey data related to January rang the alarm and in February, industrial production releases referring to December signalled that the weakening of the recovery had started already in the fourth quarter of 2015. Today, the estimates for the first quarter of 2016 for the US and the Eurozone have converged and point to a disappointing annualised rate of growth of below 1.5%.
Figure 2. GDP now-cast comparison: US vs Eurozone, Q1 2016

Source: Now-Casting Economics.
What is the historical relationship between the US and the EZ business cycles? Can past data help us interpreting the recent weakness of EZ numbers?
Traditionally, the EZ business cycle has followed the US cycle with a few months’ lag (Giannone and Reichlin 2005; Giannone et al. 2008). Let us illustrate this with two figures.
In Figure 3, we report GDP levels for the US and the Eurozone since 1970 (1970=100), marking recessions as identified by the NBER for the US (shaded red) and by CEPR for the Eurozone (shaded blue). The figure shows a close correlation between recessions on the two sides of the Atlantic, and often a lag of EZ recessions with respect to those in the US. The only exception is 2011-2012, where the recession was specific to the EZ economy; this recession was related to the debt crisis.2
Figure 3. GDP (1970=100)

Sources: BEA, Eurostat, Eurozone Wide Model.
But the lead-lag relationship is even clearer in Figure 4, where we show a synthetic indicator of the state of the real economy produced by Now-Casting, smoothed with a centred moving average. The lead-lag relationship is quite stable, with the exception of the world recession of 2008.
Figure 4. Now-casting coincident indicator

Source: Now-Casting Economics.
These figures suggest the following story. The Eurozone experienced an idiosyncratic recession in 2011-2012 related to the debt crisis. In 2014, it started to recover and during 2015, the recovery gathered strength. However, that momentum is now faltering because the EZ economy is affected, with a lag, by the slowdown of the US. The EZ economy is now paying the price for having started to recover when the US, after more than six years of recovery, is naturally slowing.
References
Giannone, D. and L. Reichlin (2005), “Eurozone and US Recessions, 1970-2003”, in L. Reichlin (ed.), Eurozone Business Cycle: Stylized Facts and Measurement Issues, pp. 83–93, CEPR.
Giannone, D., M. Lenza and L. Reichlin (2008). “Business cycles in the Eurozone”, NBER Working Paper No. w14529, Cambridge, MA.
Endnotes
[1] According to the flash release of fourth quarter growth from the BEA, the out-turn for the year was 2.24%.
[2] Notice that 2001 is consistent with the rule as both economies experienced a slowdown, but the NBER classified it as a recession while CEPR did not.
Abrazos,
PD1: Lo que dice PIMCO (la mayor gestora de renta fija del mundo) es más optimista:
PIMCO believes the global economic expansion will continue. One reason is the output gap, which is shown in the first chart. Output gap is the difference between what the economy actually produces (GDP) and what it could produce at full capacity. A negative gap means that the economy is producing less than it would at full capacity, suggesting it may still have room to grow; a positive gap means the economy is producing more than its full potential, raising concerns of overheating and a recession. After a severe drop in 2008, steady growth in output has narrowed the gap for the G7 countries (blue line), but it is still negative at -1.2%. Typically, central banks will institute or maintain policies that support economic growth when the output gap is negative. PIMCO expects central banks to do just that, and believes these policies will enable the global economy to continue its growth trend, increasing about 2.25%–2.75% in 2016 (second chart). PIMCO is also forecasting an increase in global inflation, particularly core inflation, with the potential for faster wage growth in the U.S. as a key driving force.


PD2: "Aprendamos a ser amables, a tratar bien a todos, amar sin límites, incluso a aquellos que no nos corresponden", Papa Francisco